You can mark fragments of text that interest you,
which will be available via a unique link in the browser address bar.
Comparison of five generations of processor architectures: Intel Broadwell-E, Skylake, Haswell-E, Ivy Bridge-E and AMD Vishera
Dmitry Vladimirovich 06/24/2016 00:00 Page: 1 of 3| | print version | | archive
- Page 1: Introduction, test configurations, tools and methods
- Page 2: Test results: WinRAR, Java Micro Benchmark, XnView, Adobe Photoshop CC 2015, Cinebench R15, Adobe Media Encoder CC 2015, X265, Adobe InDesign CC 2015
- Page 3: Test results: Hexus PiFast, Corona 1.3 Benchmark, SVPmark, Geekbench 3, summary, conclusion
Introduction
One, two, eight, ten - no matter how many cores you add, it will still not be enough. Processor manufacturers are confidently increasing their numbers, declaring that the main improvements are taking place in the CPU architecture. But how significant are they?
Previously, this topic was practically not raised in the laboratory, because the process itself is very long and requires the presence of a large number of components at the same time. However, we will make it clear this moment, having tested models of five generations operating at the same frequency and under the same conditions. To do this, let's take four representatives from Intel and don't forget about the opponent from AMD.
From the Intel camp, the participants will include the Core i7-4930K on the Ivy Bridge-E architecture, the Core i7-5960X on the Haswell-E architecture, the Core i7-6950X on the Broadwell-E architecture and the Core i7-6700K on the Skylake architecture. Well, they will be accompanied by the AMD FX-8370E based on the Vishera architecture, which is taking part in the test for objectivity.
All these processors are somewhat similar, but there are also global differences. Thus, Vishera and Ivy Bridge-E support DDR3 memory, and the latter does this in four-channel mode. The rest work with DDR4 memory. We tried to bring memory frequencies as close as possible, and therefore in the case of DDR4 platforms a frequency of 2133 MHz will be used.
Note that unlike Vishera, which easily survived high-frequency DDR3 memory, Ivy Bridge-E resisted, and the maximum we squeezed out of it was 1866 MHz. The difference in frequencies was compensated by timings.
Test configurations
Test bench No. 1
- Motherboard: ASUS Hero VIII (Intel Z170, LGA 1151);
- RAM: 2 x 8 GB, 2133 MHz, 15-15-15-36-1T;
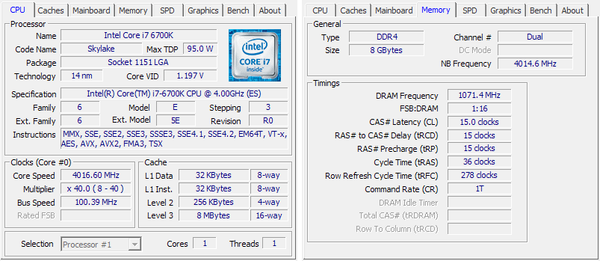
Used Intel Core The i7-6700K appears in three modes in the review:
- Intel i7-6700K 1C0H (one active core without HT);
- Intel i7-6700K 1C1H (one active core with HT);
- Intel i7-6700K 2C0H (two active cores without HT).
Test bench No. 2
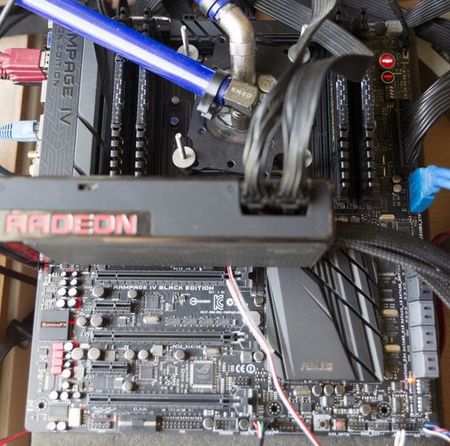
- Motherboard: ASUS Rampage IV Black Edition (Intel X79, LGA 2011);
- Cooling system: water cooling system;
- Thermal interface: Arctic Cooling MX-2;
- RAM: 4 x 4 GB, 1866 MHz, 9-10-9-27-1T;
- Hard drive: Seagate Barracuda 2 TB;
- SSD drive: Corsair Neutron GTX 240 GB;
- Video card: AMD Radeon R9 Fury X;
- Power supply: Corsair AX1500i 1500 Watt;
- Operating system: Microsoft Windows 10x64.
Processor and its operating modes
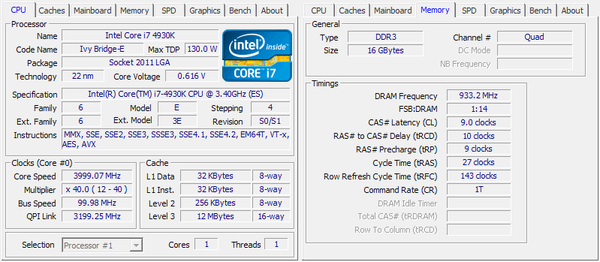
The Intel Core i7-4930K used in the review appears in three modes:
- Intel i7-4930K 1C0H (one active core without HT);
- Intel i7-4930K 1C1H (one active core with HT);
- Intel i7-4930K 2C0H (two active cores without HT).
Test bench No. 3
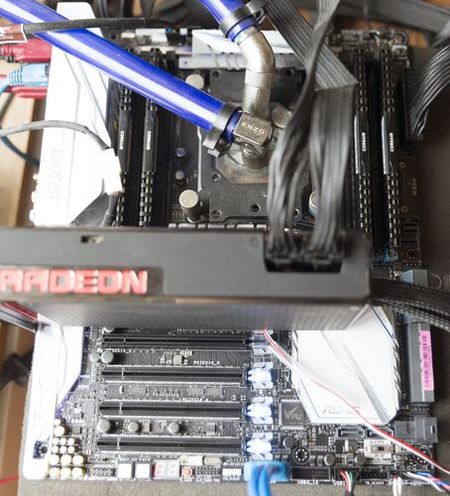
- Motherboard: ASUS X99-Deluxe II (Intel X99, LGA 2011-3);
- Cooling system: water cooling system;
- Thermal interface: Arctic Cooling MX-2;
- RAM: 4 x 4 GB, 2133 MHz, 15-15-15-36-1T;
- Hard drive: Seagate Barracuda 2 TB;
- SSD drive: Corsair Neutron GTX 240 GB;
- Video card: AMD Radeon R9 Fury X;
- Power supply: Corsair AX1500i 1500 Watt;
- Operating system: Microsoft Windows 10 x64.
Processors and their operating modes
![]()
The Intel Core i7-5960X used in the review appears in three modes:
- Intel i7-5960X 1C0H (one active core without HT);
- Intel i7-5960X 1C1H (one active core with HT);
- Intel i7-5960X 2C0H (two active cores without HT).
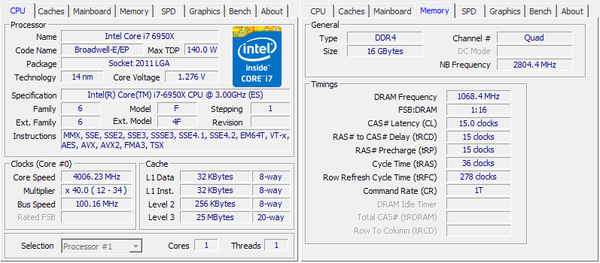
The Intel Core i7-6950X used in the review appears in three modes:
- Intel i7-6950X 1C0H (one active core without HT);
- Intel i7-6950X 1C1H (one active core with HT);
- Intel i7-6950X 2C0H (two active cores without HT).
Test bench No. 4
- Motherboard: MSI 970 Gaming (AMD 970, AM3+);
- Cooling system: water cooling system;
- Thermal interface: Arctic Cooling MX-2;
- RAM: 2 x 8 GB, 2133 MHz, 10-12-12-31-1T;
- Hard drive: Seagate Barracuda 2 TB;
- SSD drive: Corsair Neutron GTX 240 GB;
- Video card: AMD Radeon R9 Fury X;
- Power supply: Corsair AX1500i 1500 Watt;
- Operating system: Microsoft Windows 10 x64.
Processor and its operating modes
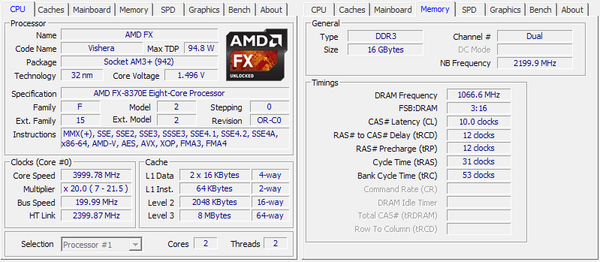
The AMD FX-8370E used in the review appears in one mode:
- AMD FX-8370 2C0H (two active cores).
Since the AMD processor cannot turn off cores independently, we had to use one active unit consisting of two cores. In reality, this configuration is similar to one Intel CPU core enabled plus active Hyper-Threading (in other words, the AMD CPU does not count in the 1C1H category).
Testing tools and methodology
It is worth talking a little about the programs used in testing and the reasons for their choice.
WinRAR x64– built-in performance test is used. The program itself is located on a disk partition located on SSD drive, thereby eliminating low performance classic HDD. The test result is the average value obtained after three runs of the program. WinRAR appears in this review for a reason, because we often have to download and unpack files. Moreover, RAR is very common among archivers and supports multithreading well.
Java Micro Benchmark. An atypical test among processor reviews, which allows you to compare system performance indicators on different platforms. The result for comparison is taken from the Arithmetic operations category.
XnView– a common program for viewing photographic material. It's free and easy to use. Additionally, it has built-in simple functions for converting formats, making changes, and more. We are interested in the time during which the program will make changes and save thirty-five NEF files. The typical requirements of an amateur photographer are presented: changing the color balance, changing the temperature, leveling the horizon, removing the bulge, adding sharpness, changing the size to 1900 pixels on the larger side. The test itself is designed for only a couple of cores, but the new instructions have a very good effect on the operation of the program. In other words, the newer the architecture and the higher the core frequency, the faster the test runs.
Adobe Photoshop CC 2015. The test result is the time it takes to apply filters to one 50 megapixel image. Standard filters and operations are applied: resizing, gamma settings, etc. Quite a typical set for the program. Unlike video encoding, Photoshop never became multi-threaded; rather, it can be called a moderately CPU-intensive program. The built-in video core is disabled. This was done due to inoperability Intel libraries and AMD.
Cinebench R15. A common CPU test in rendering.
Adobe Media Encoder CC 2015– a video converter that allows you to work with 4K video. The task is to transcode 4K video into the format of a ready-made YouTube HD 1080P 29.97 preset. Input video format: MPEG-4, Base Media / Version 2 format profile, file size 1.68 GB, constant bitrate 125 Mbps, format profile [email protected], video resolution 3840 x 2160 pixels, frame number 29.970 fps.
X265 1.5+448 8bpp X64– testing the speed of video transcoding into the promising H.265/HEVC format.
Adobe InDesign CC 2015– output of a 56-page layout material with photographs in NEF format in PDF format 1.7 printing quality.
Hexus PiFast– a test similar to SuperPI. The essence of the work is to count the number “pi” to a certain sign.
Corona 1.3 Benchmark is a rendering system developed by an enthusiast. Currently in beta testing. The benchmark uses an unchangeable set of settings.
APPLE iPhone 8 is already in CITYLINK "> APPLE iPhone 8 is already in CITYLINK
The new generation of AMD processors has finally restarted the much-anticipated arms race between the world's two main chipmakers. At the same time, only the older models of the Ryzen 7 line and the first shipments of more affordable Ryzen 5 solutions, future competitors, are available on the market Intel solutions Core i5 series are planned only for mid-April this year. This leaves Intel time to consider its next steps, and gives us the opportunity to once again evaluate the achievements of the above-mentioned Core processors i5 for 6 years of its existence.
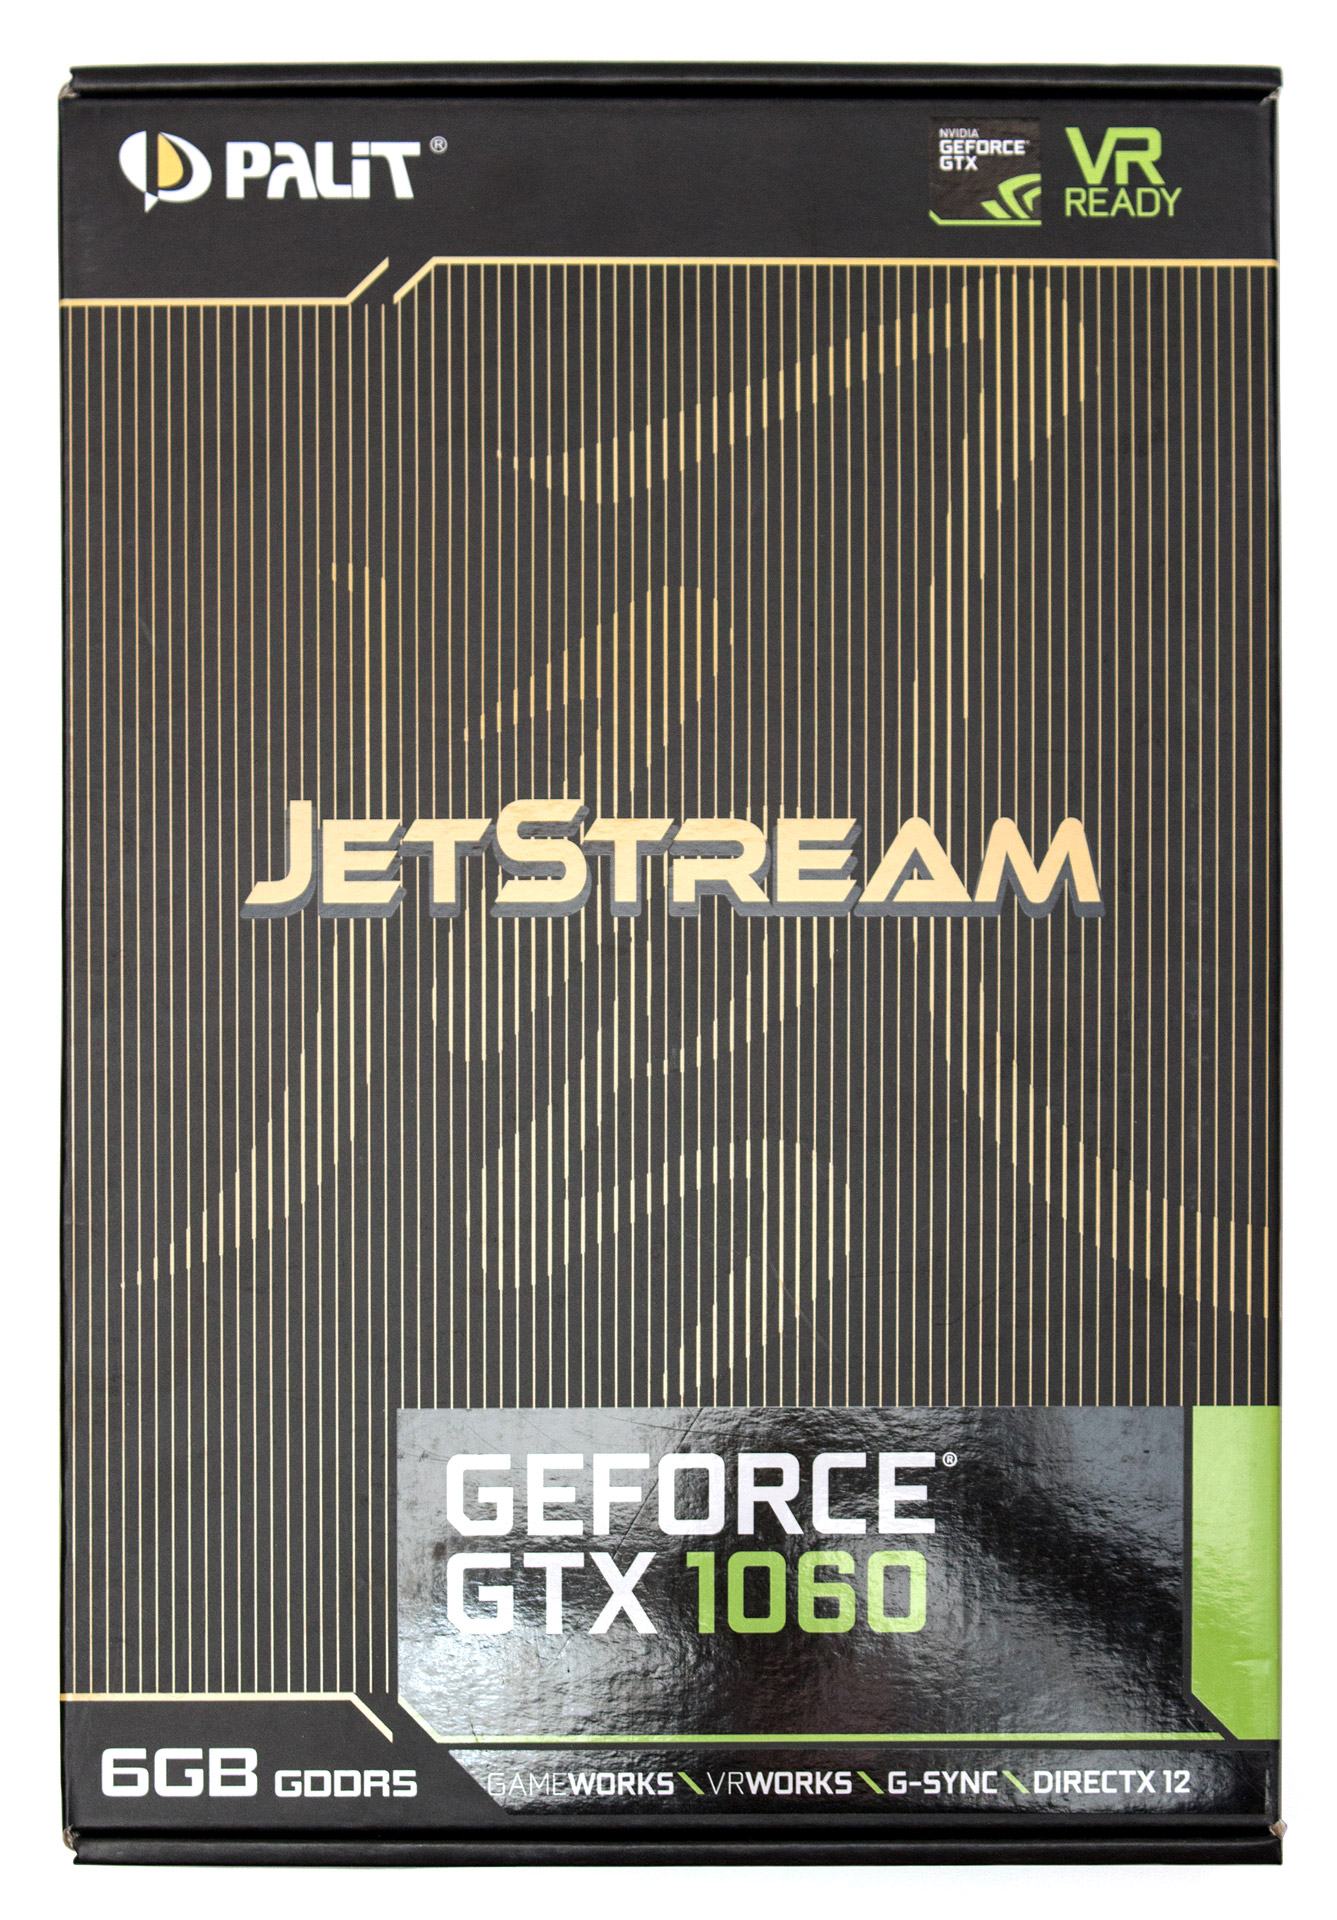
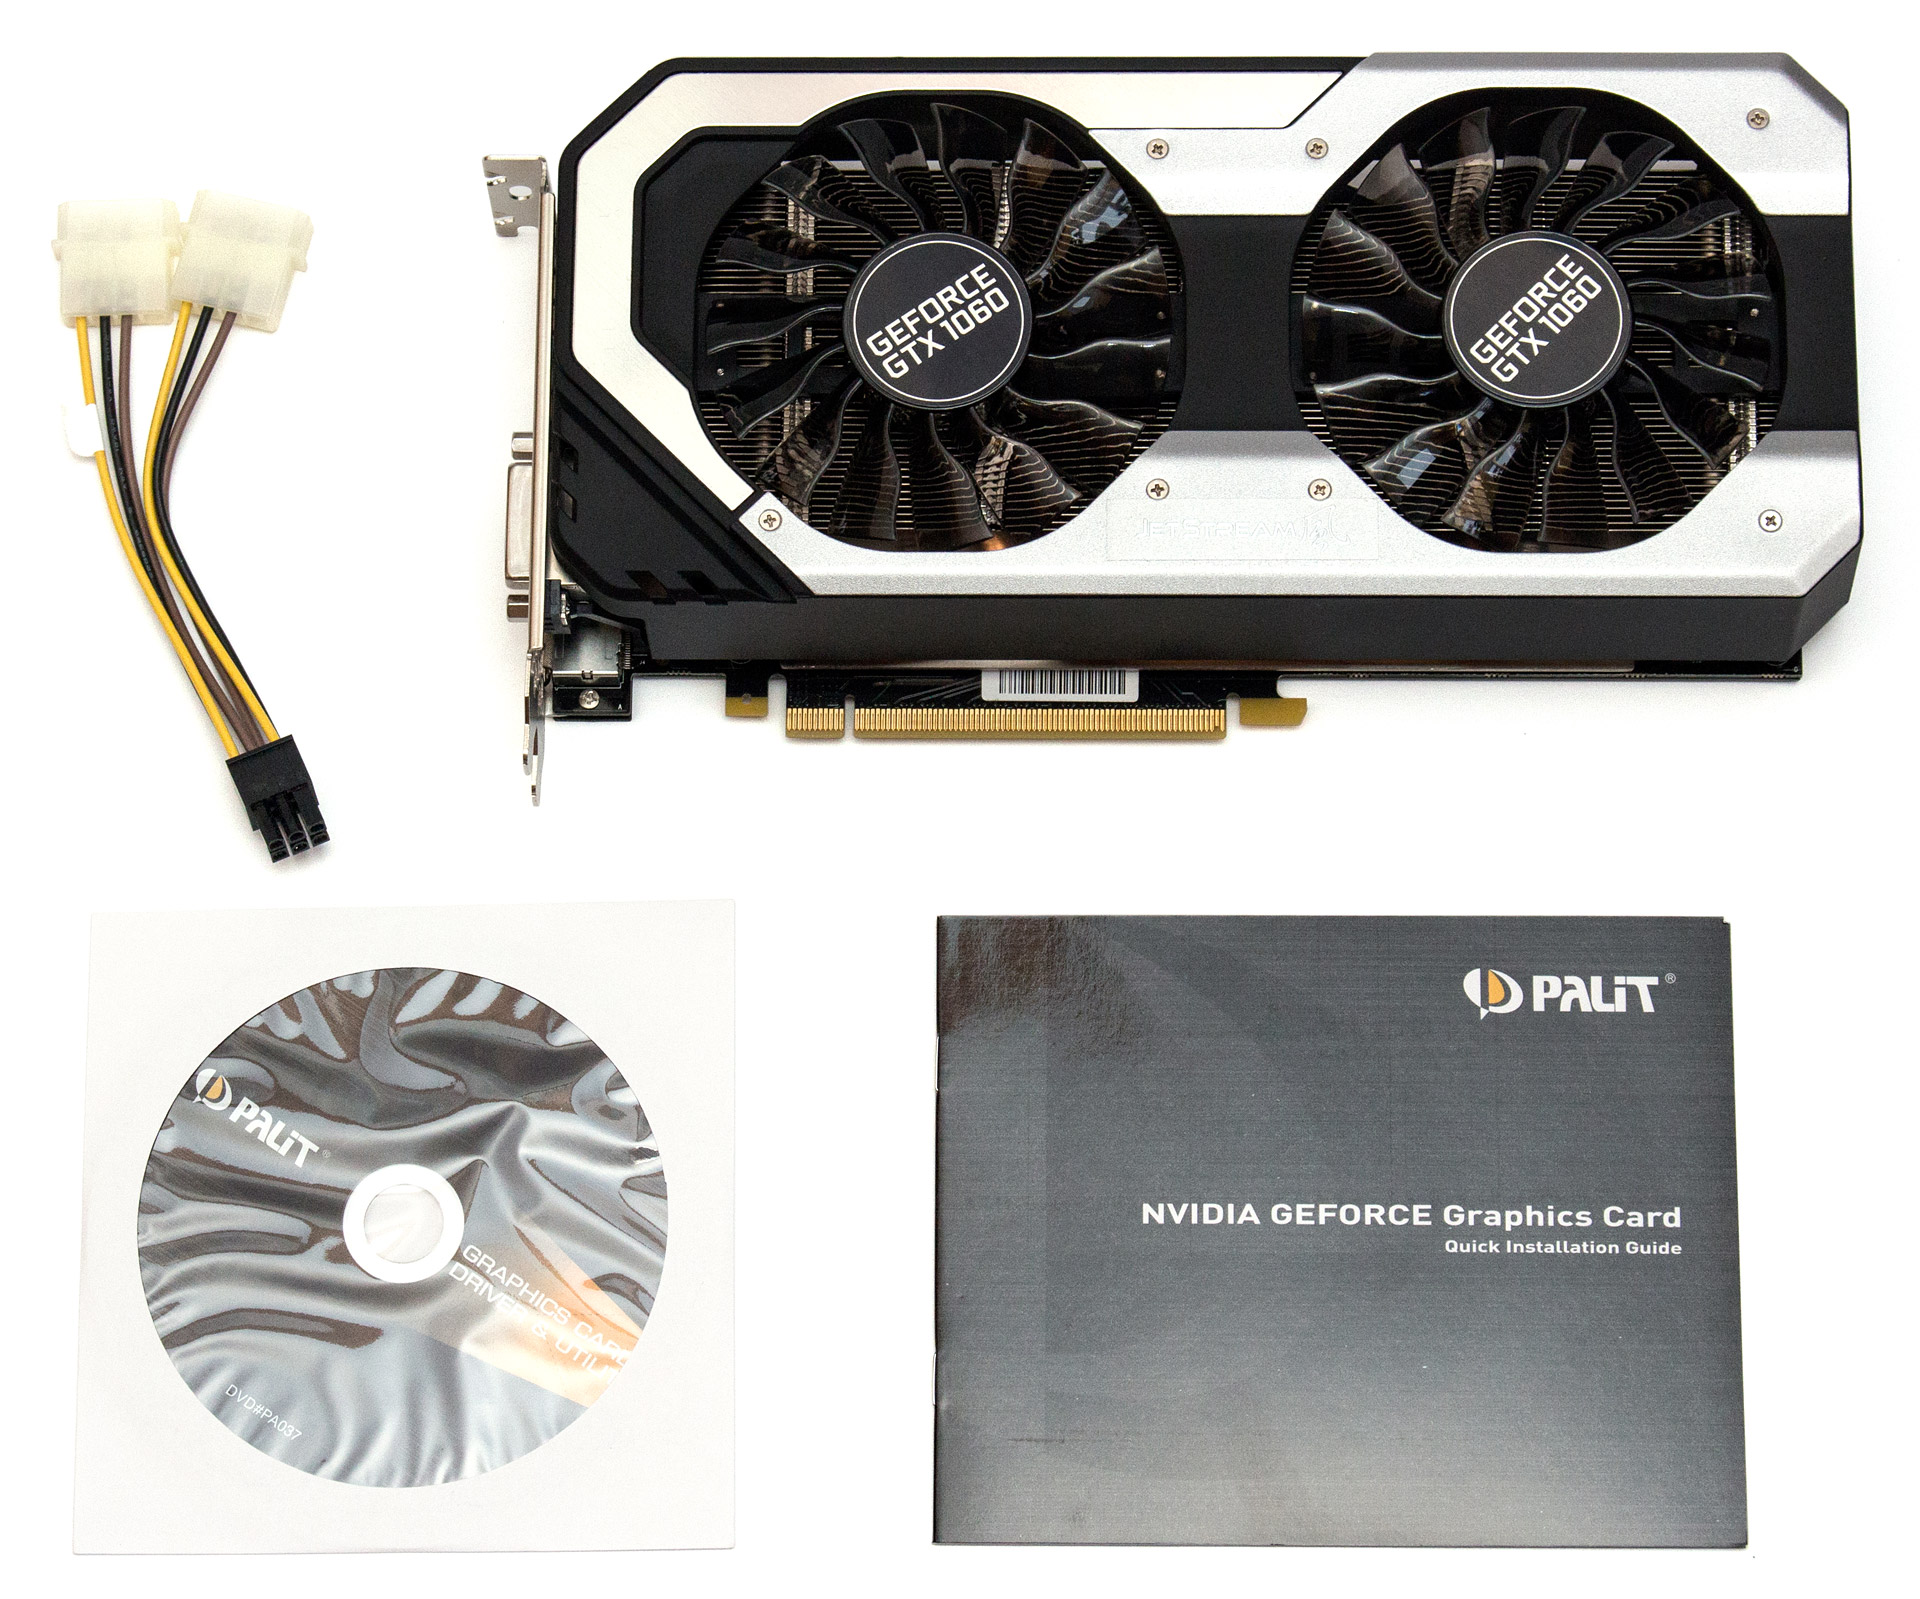
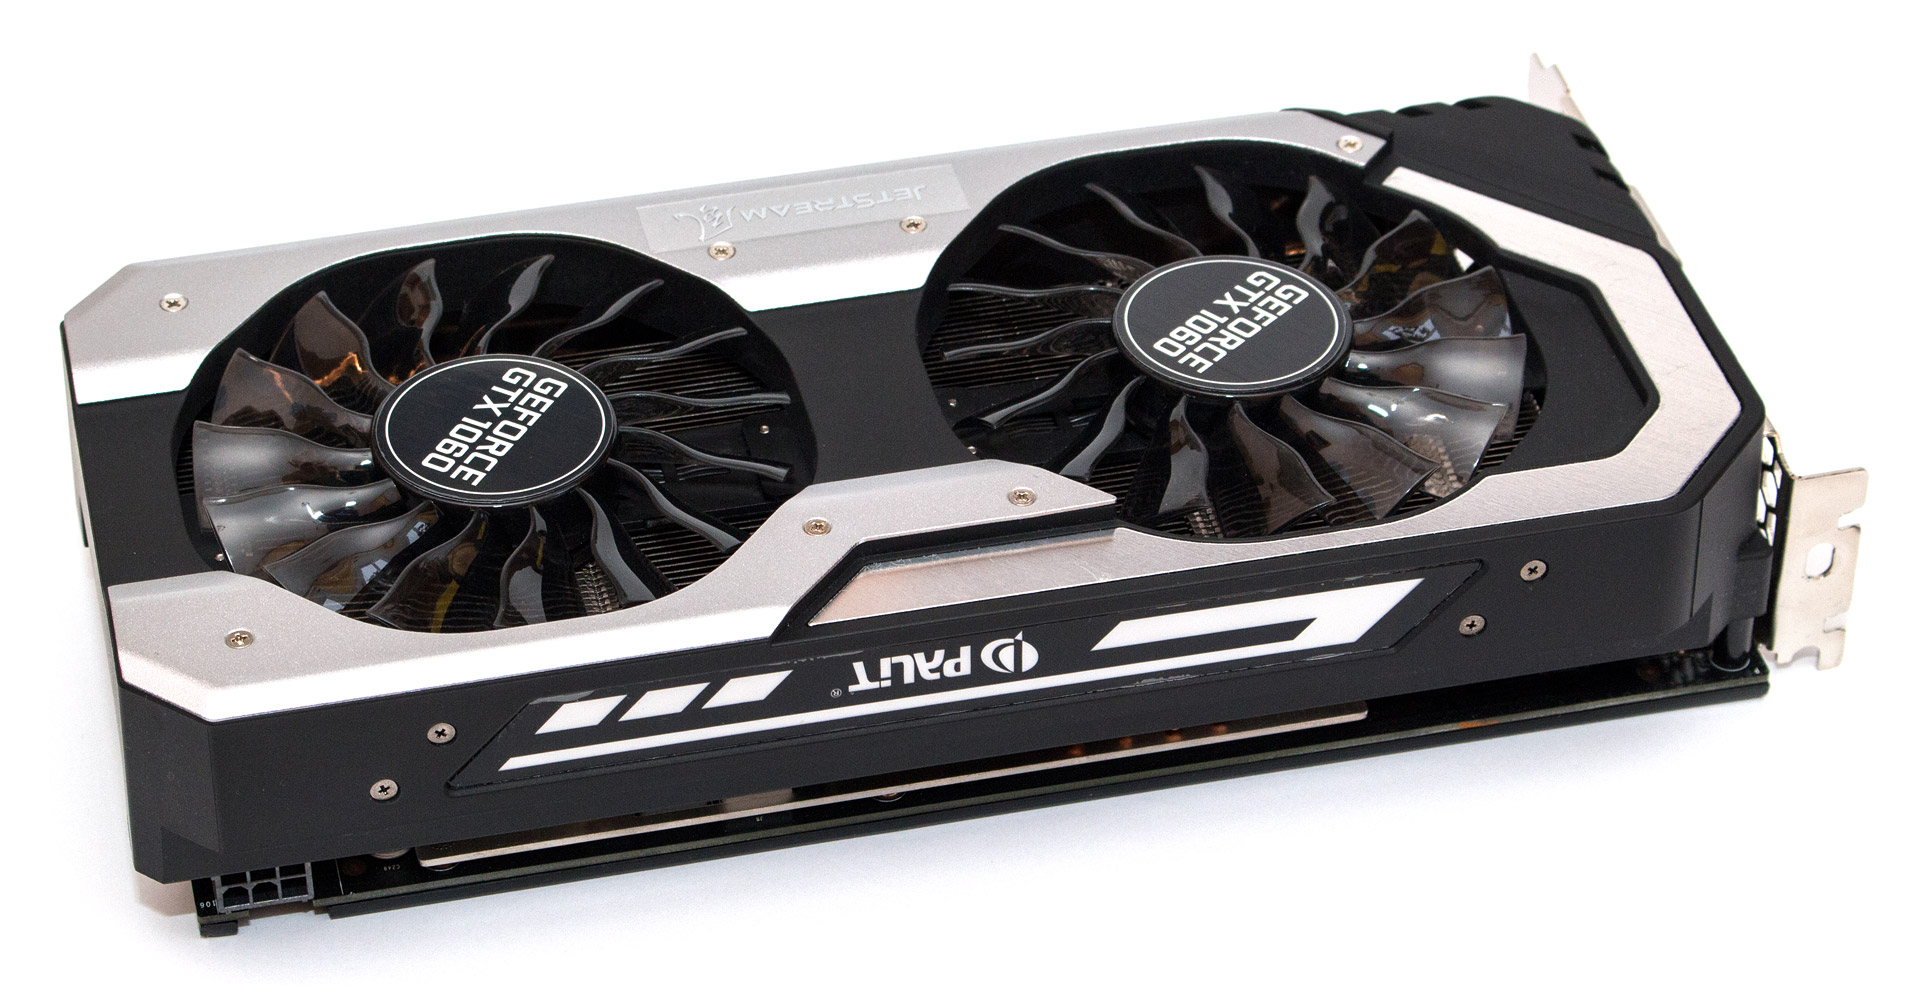
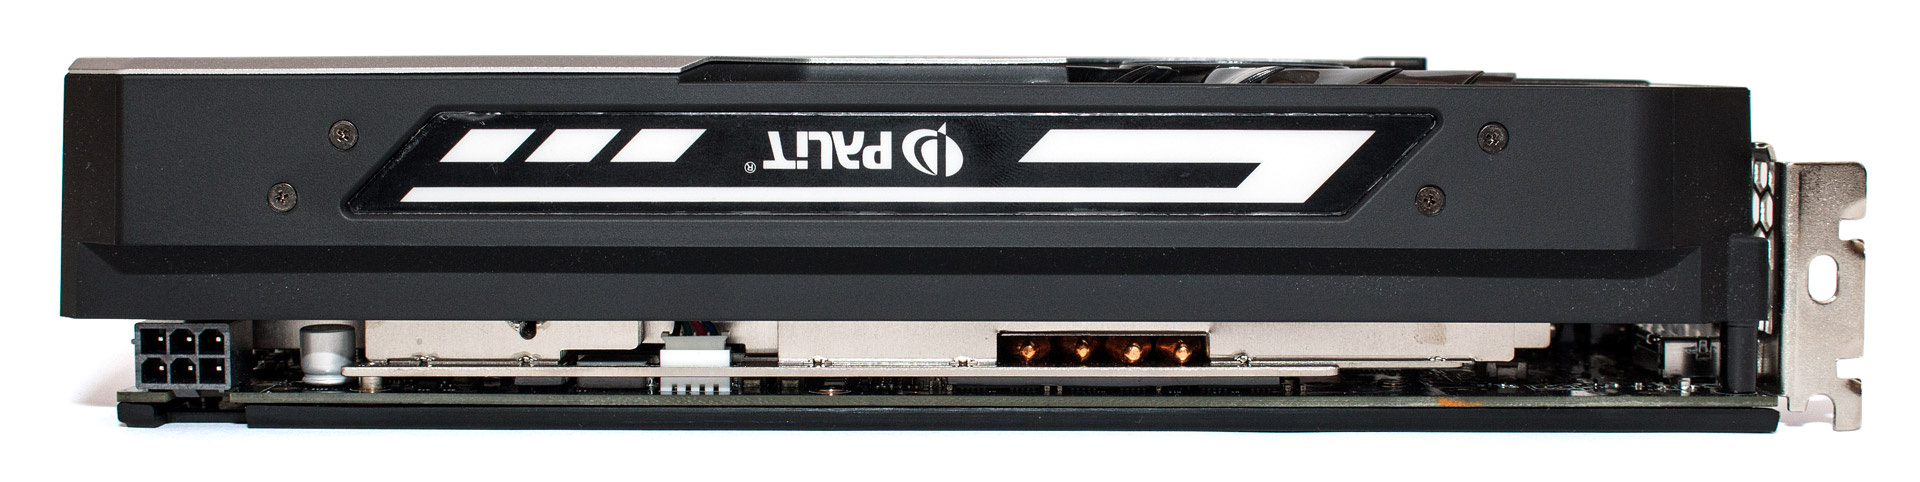
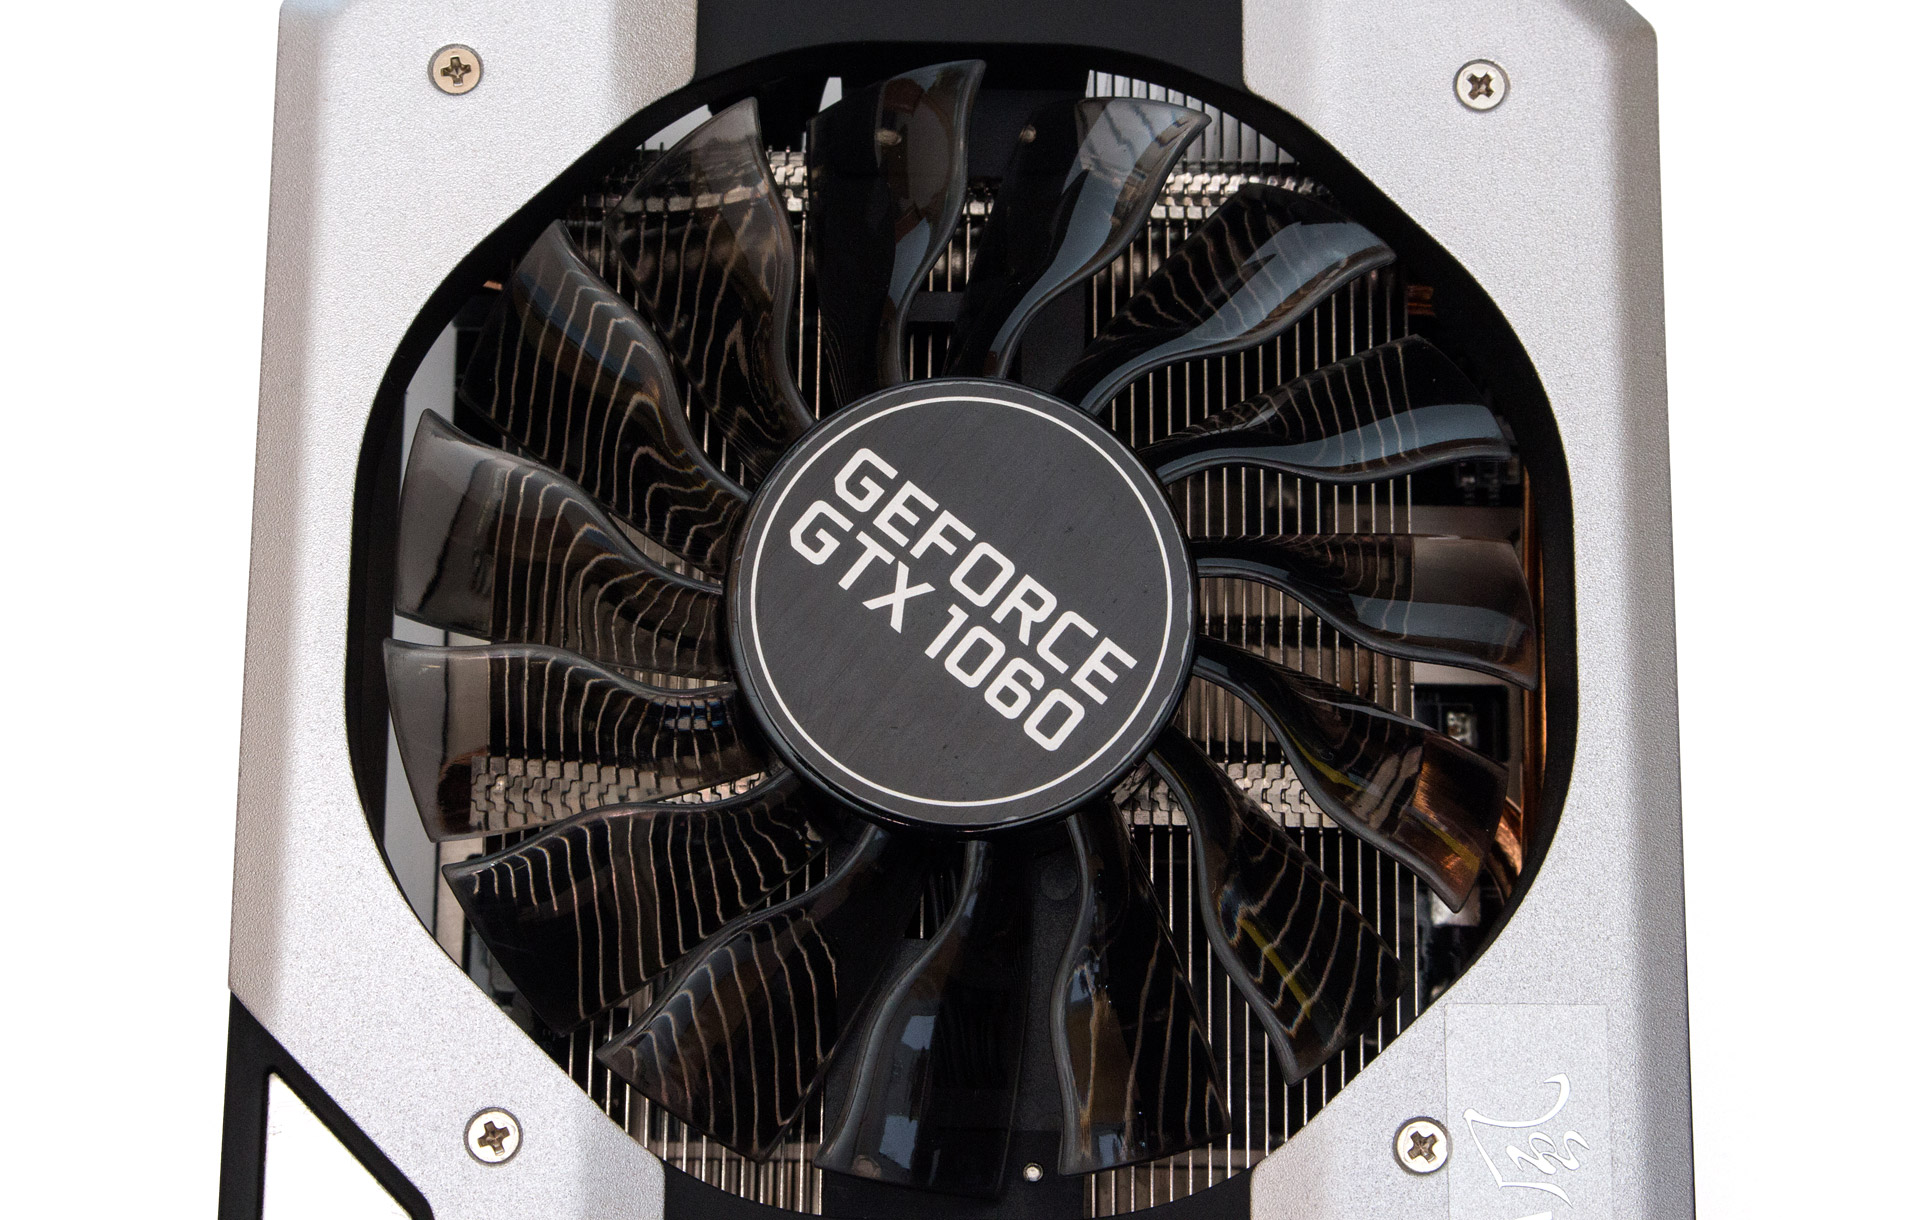
The key feature of this material is that we will consider exclusively mid-level assemblies, where video cards costing about $300 will be used as a graphics adapter. This testing model is much closer to the real situation of purchase and use, when a mid-range processor is complemented by a mid-range video card. The main goal is to check the difference in the performance of video cards in modern games depending on the generation of the installed CPU. But before moving on to the tests themselves, we want to take a closer look at one of the test participants - the Palit GeForce GTX 1060 Jetstream accelerator.
PA-GTX1060 Jetstream 6G)Palit Microsystems cannot be called a newcomer in the field of gaming video cards; the first products under the brand of the same name appeared back in the 90s. Over a long period of work in the history of the company, there were both successful and not so successful models, which led to controversial fame among the gaming community. Specifically, the JetStream series was first introduced in 2012 and after a number of improvements to the proprietary cooling system in subsequent generations, it turned into one of the most attractive offers among all current solutions based on NVIDIA GPUs. It should be noted that there are no design differences between the JetStream and Super JetStream lines. The only difference is that the latter has factory overclocking, which allows advanced users to save an additional $20-25 by overclocking the video card manually.
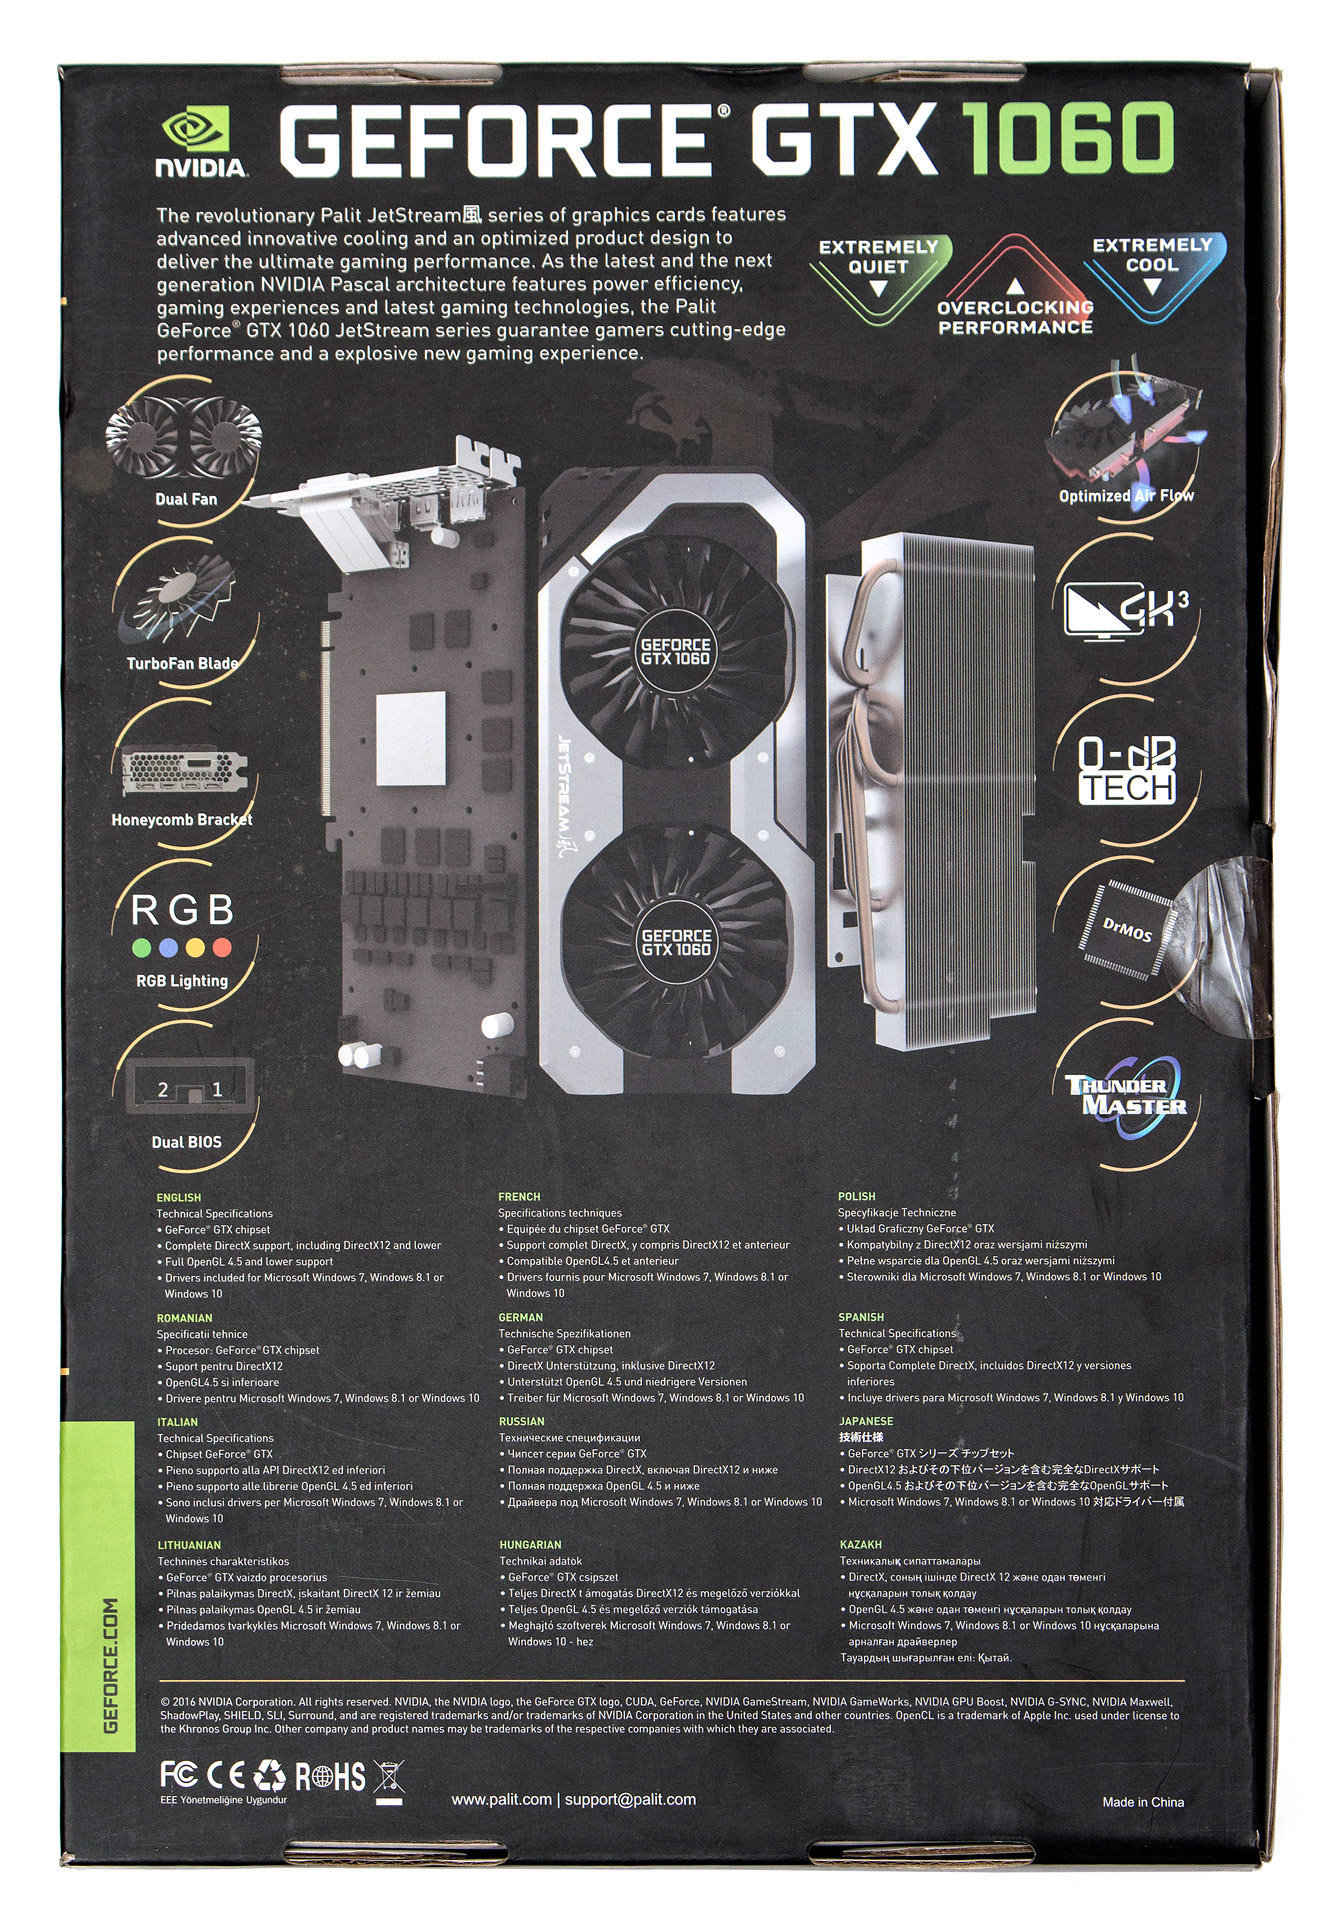
The accelerator is supplied in a large cardboard box, made in a characteristic color scheme registration The back side lists the key features and advantages of the card: the presence of two BIOSes, switchable fans with a proprietary blade design, support for 4K resolution, etc. We didn’t forget to mention the customizable RGB lighting system.
The delivery set is standard and does not contain any additional accessories. It included: a video card, a driver disk, a user manual and an adapter from six pins to two Molexes.
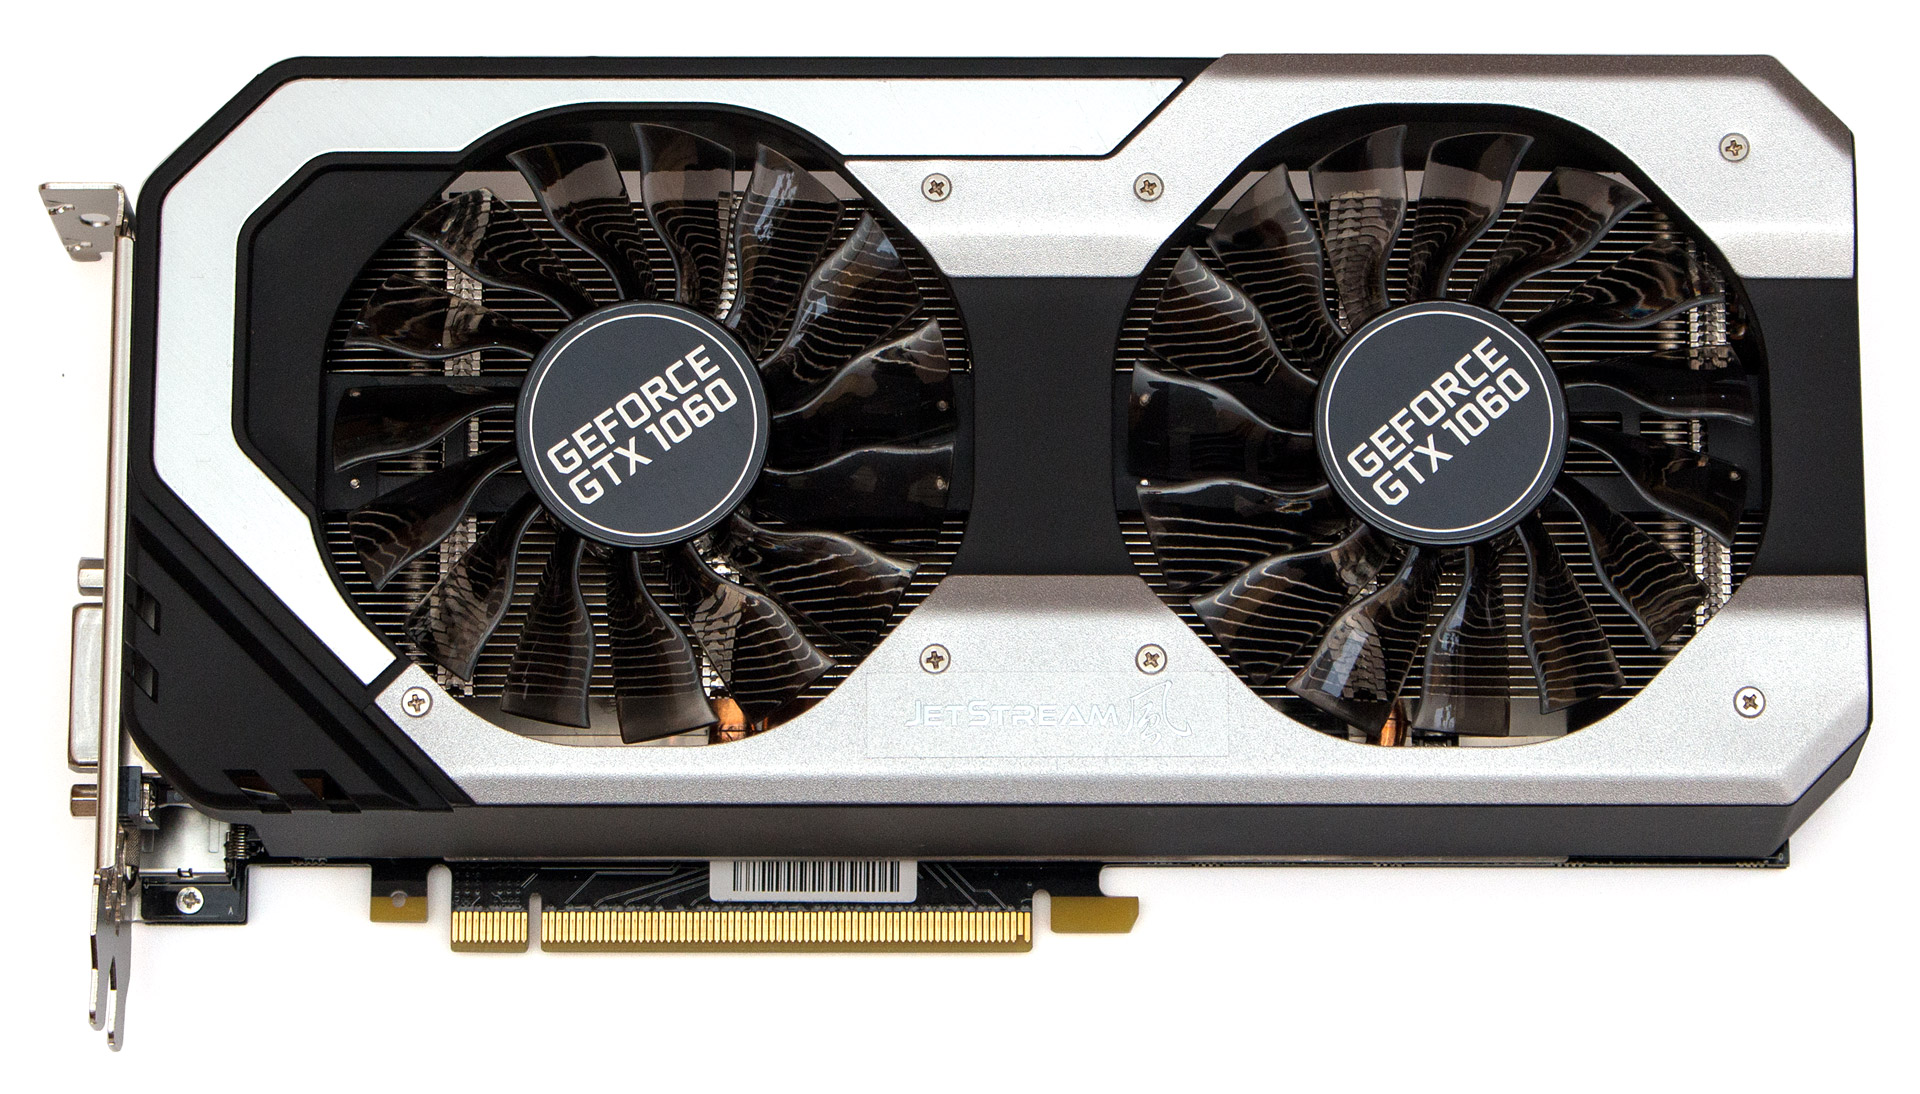
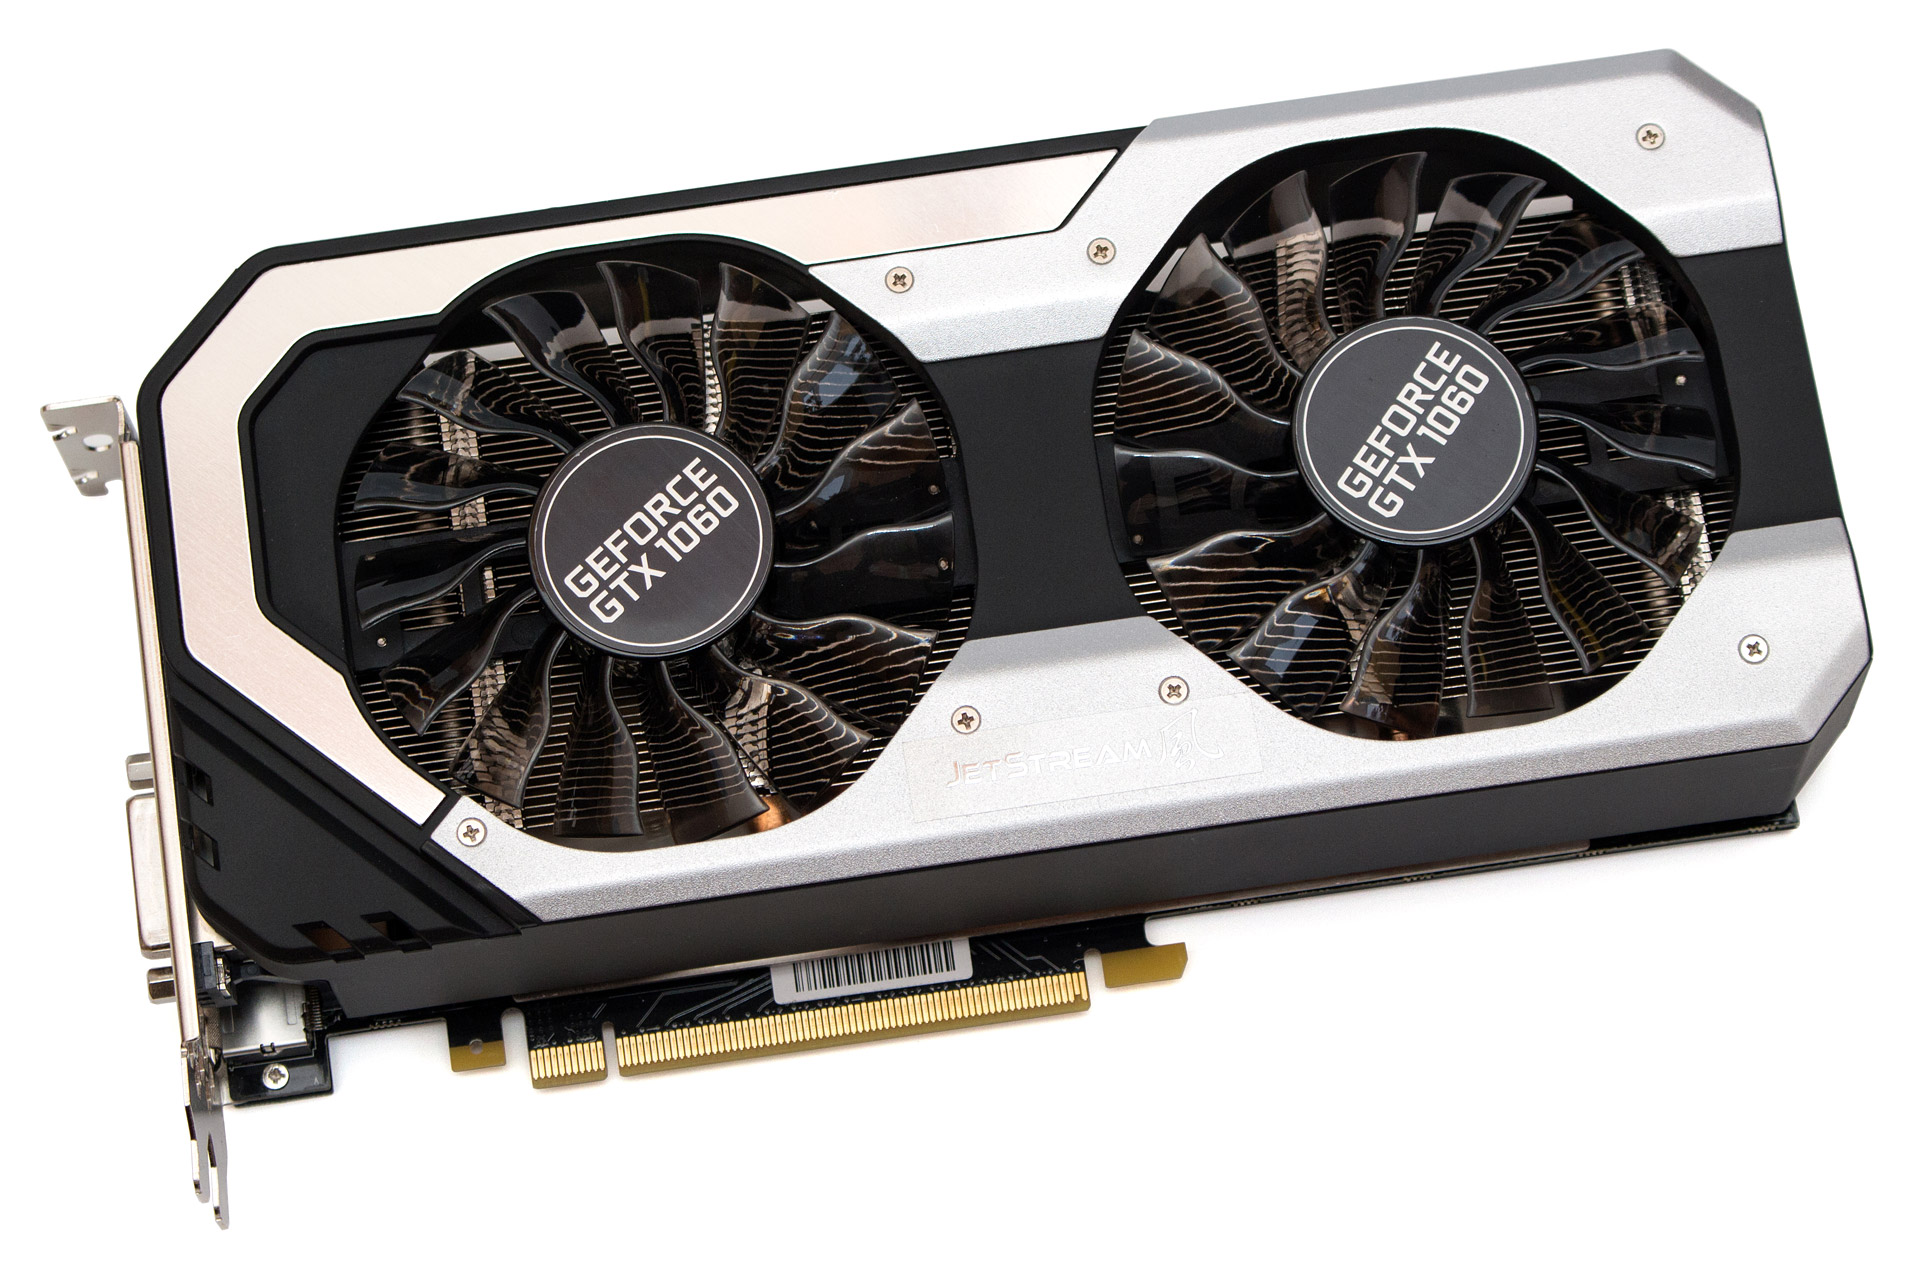
The design is classic, which is frankly pleasing against the backdrop of the dominance of bulky, futuristic casings from other vendors.
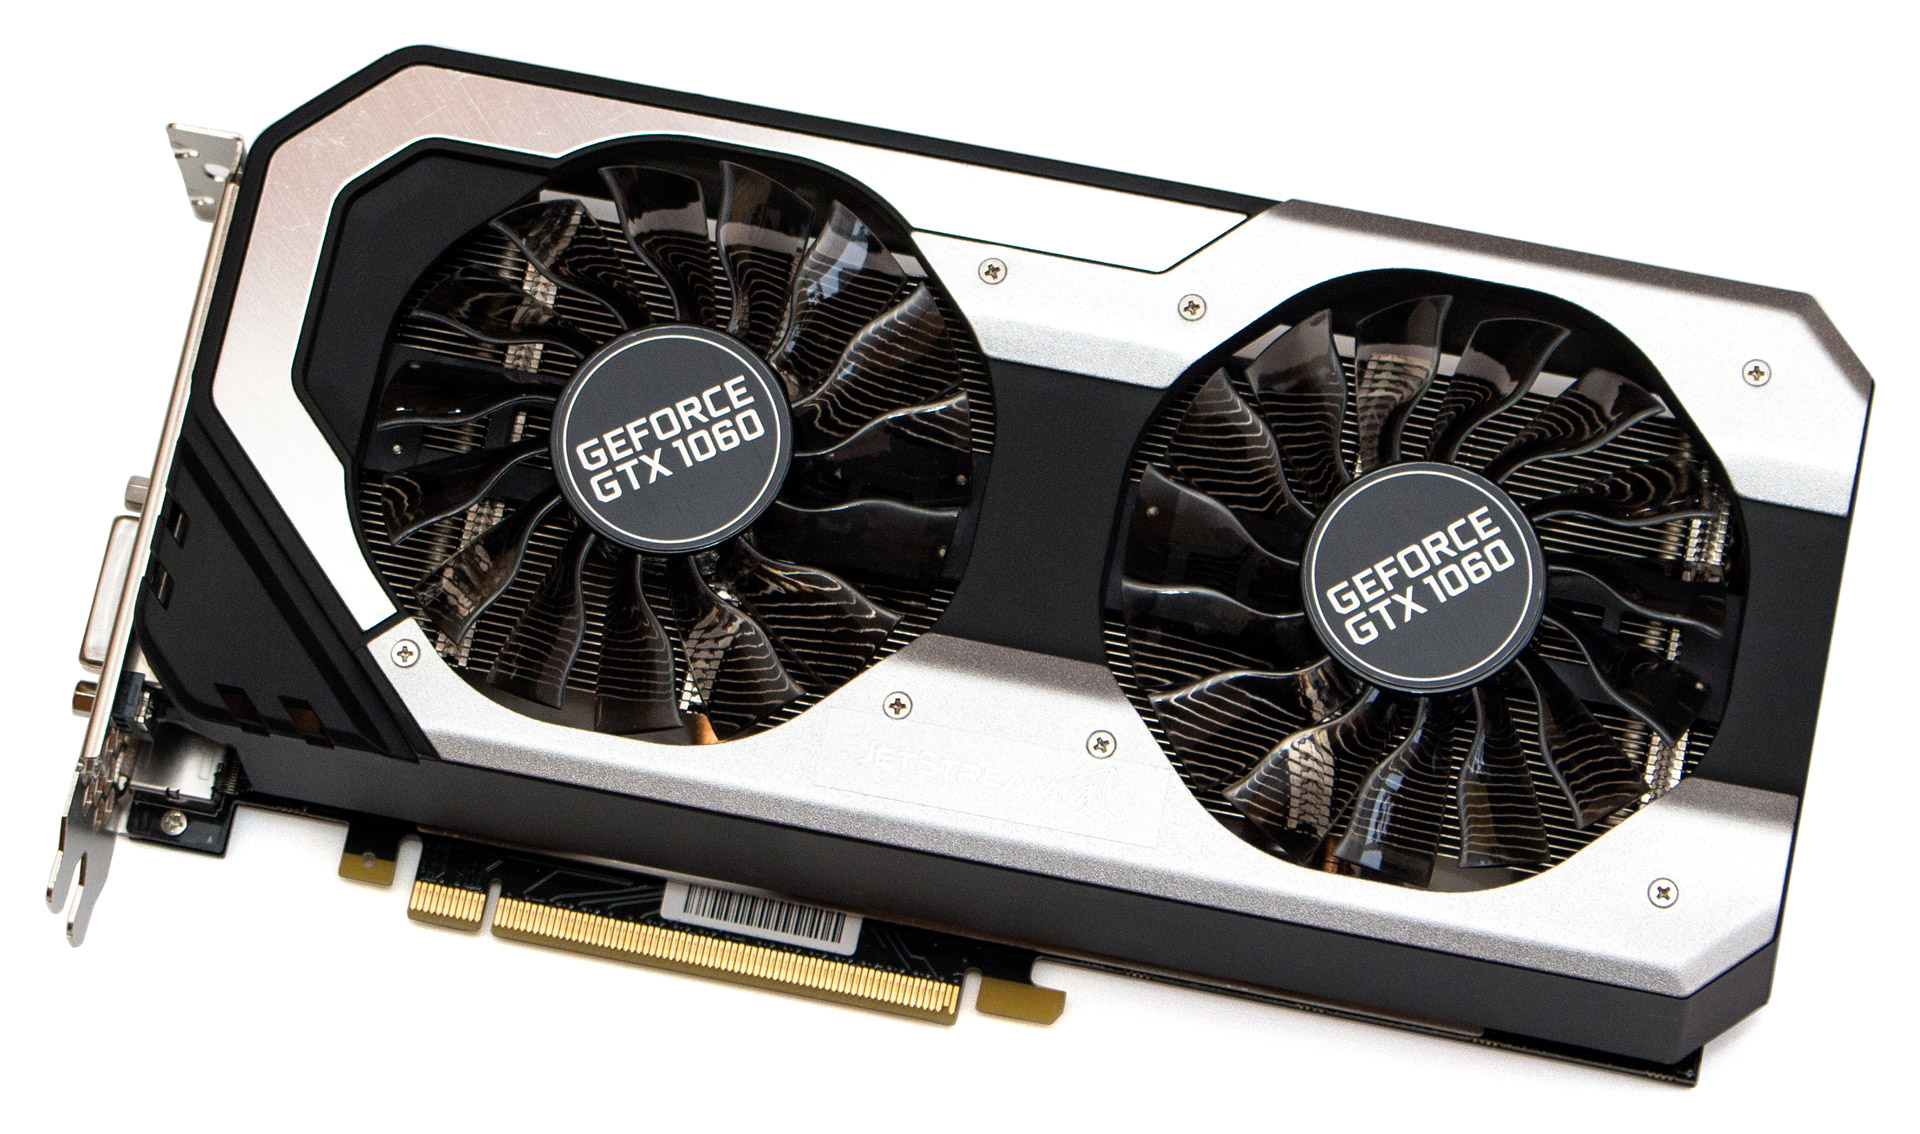
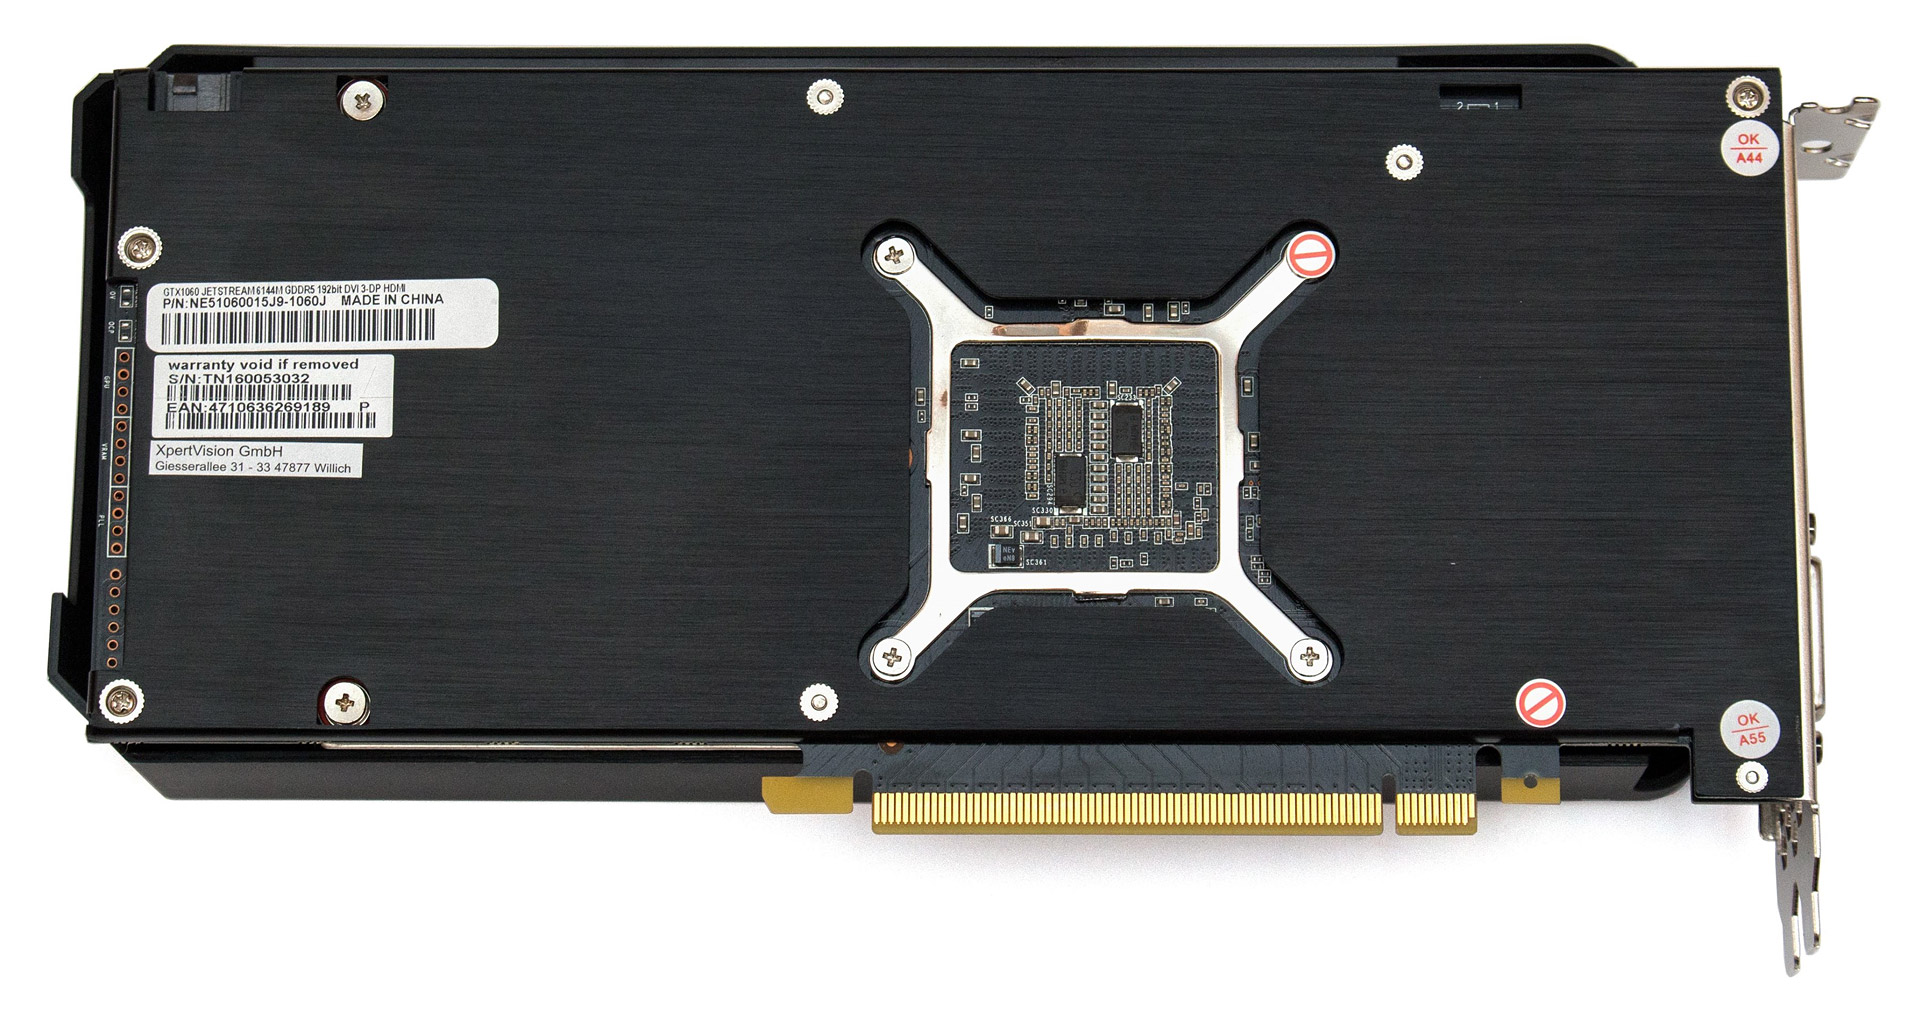
The dimensions of the card are 248x123x52 mm. It can be easily installed in most standard cases; at the same time, when configuring the system, it is necessary to take into account that the cooler occupies 2.5 slots in height. The reverse side of the board is covered with a metal plate designed to increase the rigidity of the overall structure.
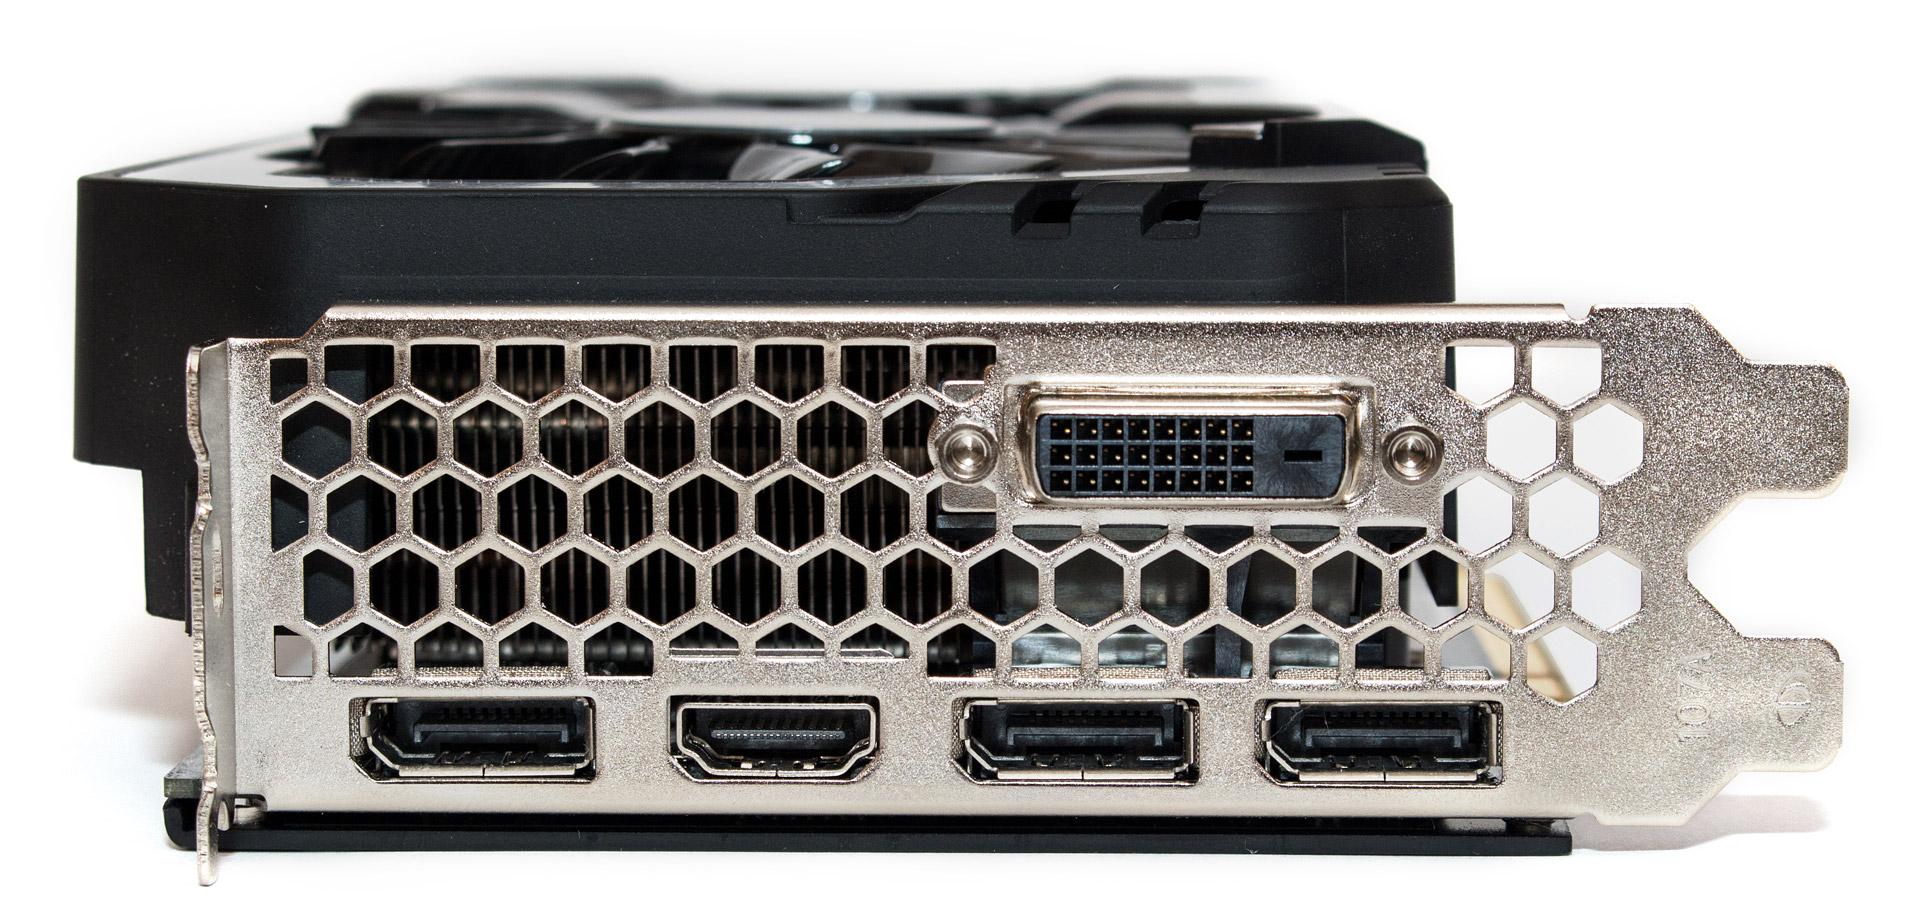
Additional power is connected via one six-pin connector located in the extreme right corner at the end. The connector latch faces upward, making installation easier.
The available image output connectors on the rear panel include: three DisplayPort 1.4 ports, one HDMI 2.0b and one DVI.
The cooling system consists of a nickel-plated radiator and two fans with a diameter of 90 mm each. The active CO mode starts at 55 °C, until it is reached the video card remains absolutely silent.
The radiator is pierced by four heat pipes, but direct contact with the graphics chip passes through a large plate. It also covers key batteries, as well as memory chips, which improves the overall temperature of the device.
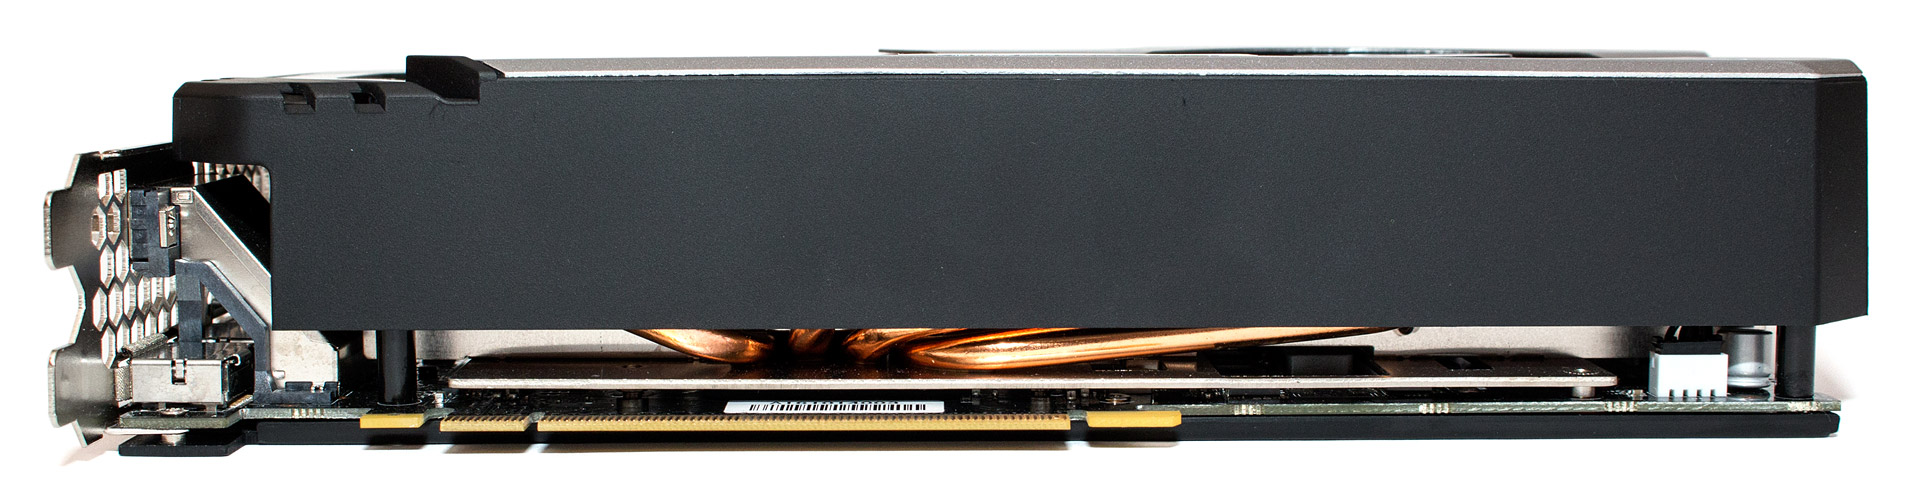
The external massiveness of the cooler in practice is a visual illusion caused by the design of the casing. If you look closely at the photo below, you can see that the radiator is actually only about 80mm wide. The remaining space is occupied by protruding heat pipes and fan blades.
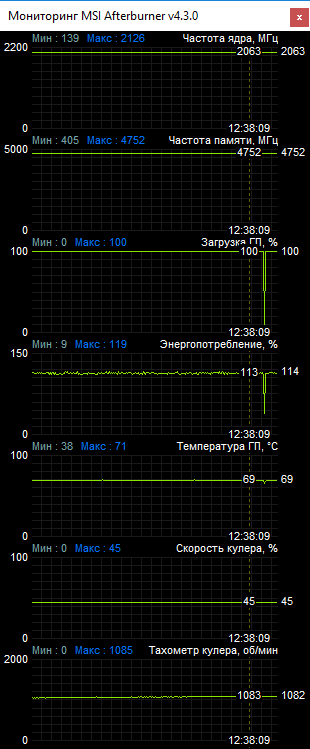
Although printed circuit board The Palit GeForce GTX 1060 Jetstream 6GB is modified; its GPU power subsystem has three phases, just like the reference design models. Another phase is responsible for six gigabytes of GDDR5 memory manufactured by Samsung. On the one hand, you can lament about this, because most competitive solutions use 5-6 phases for their graphics core at once. On the other hand, in none of the GeForce GTX 1060 series accelerators we previously tested did the presence of a larger number of phases provide a higher level of overclocking. In this case, the upper clock frequency threshold depends on the available power limit, which, in turn, is strictly regulated by NVIDIA engineers and does not depend in any way on the number of phases involved.
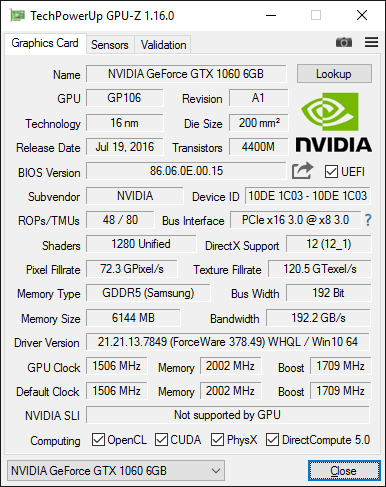
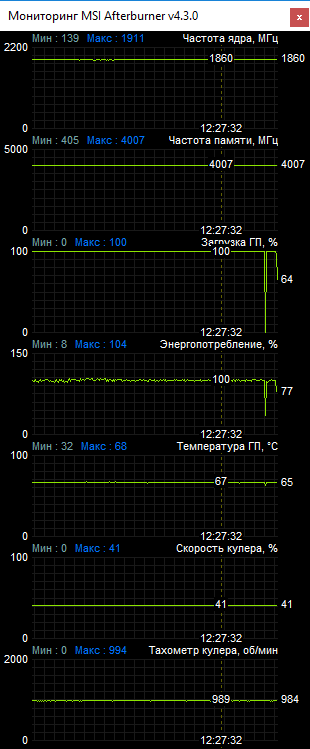
By default, the review hero runs on the reference frequency scheme for the GeForce GTX 1060: the base core frequency is 1506 MHz, the Boost Clock is 1709 MHz, the actual Boost frequency in gaming applications is 1860 MHz, the effective memory frequency is 8008 MHz.
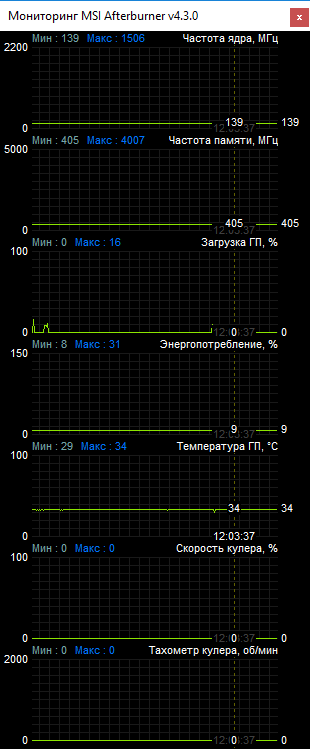
The capabilities of the cooling system were tested on an open bench (ambient temperature 26 °C). In the absence of significant load, the core temperature was 34 °C; watching a video on YouTube or simply surfing the Internet increased it to a maximum of 39 °C. Ten minutes of playing The Witcher 3: Wild Hunt were able to warm up the GPU to 68 °C, while the fan rotation speed reached an insignificant 990 rpm, and the level of generated noise can be described as minimal. If the Palit GeForce GTX 1060 Jetstream 6GB is placed in a closed case, then most likely the user is unlikely to hear it against the background sound of the rest of the PC components, even during peak loads.
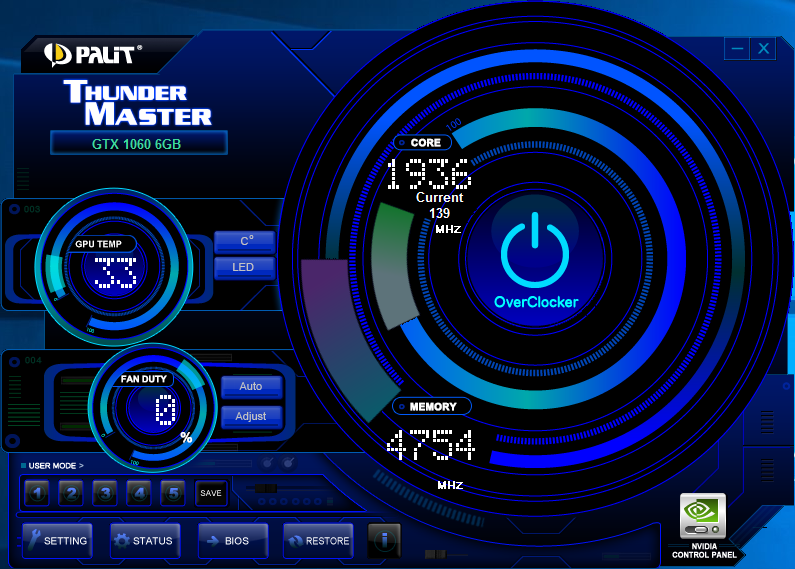
During manual overclocking, only the clock frequencies and Temp values were adjusted. Limit and Power Limit (the latter can be raised to 116%). Changing the GPU voltage is available within minimal limits, but has absolutely no effect on the final result.
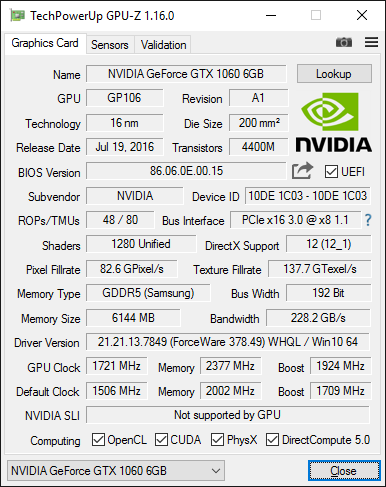
After completing the steps described above, the base core frequency was increased to 1721 MHz. The Boost value reached 2101 MHz, with drops to 2063 MHz in the most severe modes. The memory operated stably at a frequency of 9508 MHz. As expected, opportunities standard system enough food to get by GPU NVIDIA GP106 full performance potential. The maximum core temperature increased slightly - to 71 degrees. The fan rotation speed has increased to 1080 rpm. The noise level remained unchanged.
The Palit GeForce GTX 1060 Jetstream 6GB comes with a proprietary Thunder Master utility. Its functionality completely repeats the well-known MSI program Afterburner, so the only reason why future owners should remember the existence of Thunder Master is the ability to configure or disable the backlight of the Palit logo located on the end of the video card.
Testing methodology
Two mid-budget models were chosen as test video cards, one from each camp. The Palit GeForce GTX 1060 Jetstream 6GB is supported by the ASUS ROG Strix Radeon RX 480 8GB accelerator. Both video cards were tested at maximum frequencies, taking into account overclocking. The exact frequency patterns are shown in the table.
| Video adapter | Palit GeForce GTX 1060 Jetstream | ASUS ROG Strix Radeon RX 480 |
|---|---|---|
| Core | GP106 | Polaris 10 |
| Number of transistors, million pieces | 4400 | 5700 |
| Technical process, nm | 16 | 14 |
| Core area, sq. mm | 200 | 232 |
| Number of stream processors | 1280 | 2304 |
| Number of texture blocks | 80 | 144 |
| Number of rendering units | 48 | 32 |
| Core frequency, MHz | 1936-2101 | 1360 |
| Memory bus, bit | 192 | 256 |
| Memory type | GDDR5 | GDDR5 |
| Memory frequency, MHz | 9504 | 8600 |
| Memory capacity, MB | 6144 | 8192 |
| Supported DirectX Version | 12 | 12 |
| Interface | PCI-E 3.0 | PCI-E 3.0 |
| Power, W | 120 | 150 |
The processor pool consisted of five Intel Core i5 CPUs from five different generations: Sandy Bridge, Ivy Bridge, Haswell, Skylake, Kaby Lake. Each processor was tested in two operating modes:
- nominal - the clock frequency corresponded to the default CPU settings and was not limited in any way. This mode should demonstrate the potential of processors out of the box, and will also be useful for owners of Core i5 without the “K” index;
- during overclocking - the clock frequency was fixed at a single mark of 4400 MHz (with the exception of the Core i5-3470). This mode should demonstrate the difference in processor speed depending on the architecture of the installed CPU.
| CPU | Core i5-2500K | Core i5-3470 | Core i5-4690K | Core i5-6600K | Core i5-7600K |
|---|---|---|---|---|---|
| Core | Sandy Bridge | Ivy Bridge | Haswell | Skylake | Kaby Lake |
| Connector | LGA1155 | LGA1155 | LGA1150 | LGA1151 | LGA1151 |
| Technical process, nm | 32 | 22 | 22 | 14 | 14 |
| Number of cores | 4 | 4 | 4 | 4 | 4 |
| Rated frequency, MHz | 3300 | 3200 | 3500 | 3500 | 3800 |
| Turbo Boost frequency, MHz | 3700 | 3600 | 3900 | 3900 | 4200 |
| L1 cache, KB | 32 x 4 + 32 x 4 | 32 x 4 + 32 x 4 | 32 x 4 + 32 x 4 | 32 x 4 + 32 x 4 | 32 x 4 + 32 x 4 |
| L2 cache, KB | 256 x 4 | 256 x 4 | 256 x 4 | 256 x 4 | 256 x 4 |
| L3 cache, MB | 6 | 6 | 6 | 6 | 6 |
| Graphics core | Intel HD Graphics 3000 | Intel HD Graphics 2500 | Intel HD Graphics 4600 | Intel HD Graphics 530 | Intel HD Graphics 630 |
| Graphics core frequency, MHz | 1100 | 1100 | 1200 | 1150 | 1150 |
| Supported memory type | DDR3-1333 | DDR3-1600 | DDR3-1600 | DDR4-2133 | DDR4-2400 |
| TDP, W | 95 | 77 | 88 | 91 | 91 |
Separately, we decided to check the relevance of the statement that the Core i5-2500K central processor, even today, is able to compete with its new brothers due to stable operation at higher frequencies, which is ensured by the presence of solder and the good overclocking potential of Sandy Bridge. We managed to overclock our Core i5-2500K to 4800 MHz, at which it was further tested. For the purity of the experiment, the fresh Core i5-7600K was similarly overclocked to the maximum. He achieved a clock frequency of the coveted 5000 MHz. The obtained indicators in this mode were added to the final results as a separate line.
| CPU | Core i5-2500K | Core i5-3470 | Core i5-4690K | Core i5-6600K | Core i5-7600K |
|---|---|---|---|---|---|
| CPU frequency (nominal) | 3300 (3700) | 3200 (3600) | 3500 (3900) | 3500 (3900) | 3800 (4200) |
| CPU frequency (OS 1) | 4400 | - | 4400 | 4400 | 4400 |
| CPU frequency (OS 2) | 4800 | - | - | - | 5000 |
| RAM frequency | DDR3-1866 | DDR3-1866 | DDR3-1866 | DDR4-3000 | DDR4-3000 |
As for the RAM frequency, we did not equalize it, since we tried to conduct the test in conditions as close as possible to real ones. Supported by Skylake or Kaby Lake platforms random access memory The DDR4 standard is one of their key advantages and if high-frequency memory can have an impact on the final FPS in games, then this must be taken into account when deciding whether to upgrade the system.
Test configurations
In total, we involved three test bench, which, taking into account all testing modes, gives 22 different variations of the “CPU + GPU” combinations.
Test bench No. 1:
- processor No. 1: Intel Core i5-2500K;
- processor No. 2: Intel Core i5-3470;
- motherboard: ASUS Maximus V Extreme (Intel Z77);
- system drive: GeIL Zenith R3 240 GB (240 GB, SATA 6 Gbit/s);
Test bench No. 2:
- processor: Intel Core i5-4690K;
- video card No. 1: Palit GeForce GTX 1060 Jetstream (GeForce GTX 1060 6 GB);
- video card No. 2: ASUS ROG Strix Radeon RX 480 (Radeon RX 480 8 GB);
- motherboard: MSI Z87M Gaming (Intel Z87);
- cooler: Noctua NH-U14S (NF-A15 PWM fan, 140 mm);
- RAM: GoodRAM GY1600D364L10/16GDC (2x8 GB, 1866 MHz, 10-10-10-28-1T);
- system disk: ADATA SX900 256 GB (256 GB, SATA 6 Gbit/s);
- power supply: Chieftec CTG-750C (750 W).
Test bench No. 3:
- processor No. 1: Intel Core i5-6600K;
- processor No. 2: Intel Core i5-7600K;
- video card No. 1: Palit GeForce GTX 1060 Jetstream (GeForce GTX 1060 6 GB);
- video card No. 2: ASUS ROG Strix Radeon RX 480 (Radeon RX 480 8 GB);
- motherboard: MSI Z170A Gaming M7 (Intel Z170);
- cooler: Noctua NH-U14S (NF-A15 PWM fan, 140 mm);
- RAM: HyperX Savage HX424C12SBK2/16 (2x8 GB, 3000 MHz, 14-15-15-35-1T);
- system drive: Crucial MX300 275 GB (275 GB, SATA 6 Gbps);
- power supply: Chieftec CTG-750C (750 W);
- operating system and drivers:
- operating system: Microsoft Windows 10 x64;
- GeForce driver: NVIDIA GeForce 378.49;
- Radeon driver: ATI Crimson 17.1.2.
Game application settings
FPS measurements were carried out in 11 real gaming applications and in one synthetic test. The screen resolution was 1920x1080 pixels. The frame rate was recorded using in-game benchmarks or using the Fraps utility v.3.5.99. Each test scene was repeated three to five times to minimize possible error, after which the average result was displayed. The final graphs show the values of minimum and average fps.
Graphics settings were set to maximum or close to maximum. Vertical frame synchronization was forcibly disabled for all games. Where necessary, through console commands The built-in fps limiters were removed. An exact list of all settings and test scenes can be found in the description of each application.
Dota 2
Battlefield 1
![]()

![]()
![]()
Deus Ex: Mankind Divided
Far Cry Primal
Testing took place in the built-in gaming benchmark.
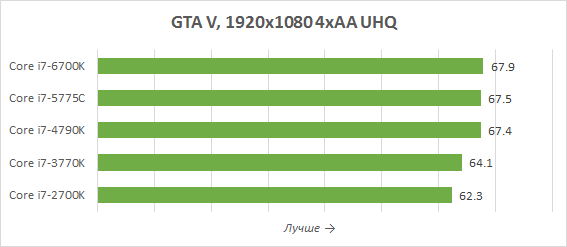
GTA V


Testing took place in the built-in gaming benchmark.
Shadow Warrior 2
The Witcher 3: Wild Hunt

Watch Dogs 2
Test results
3DMark Fire Strike

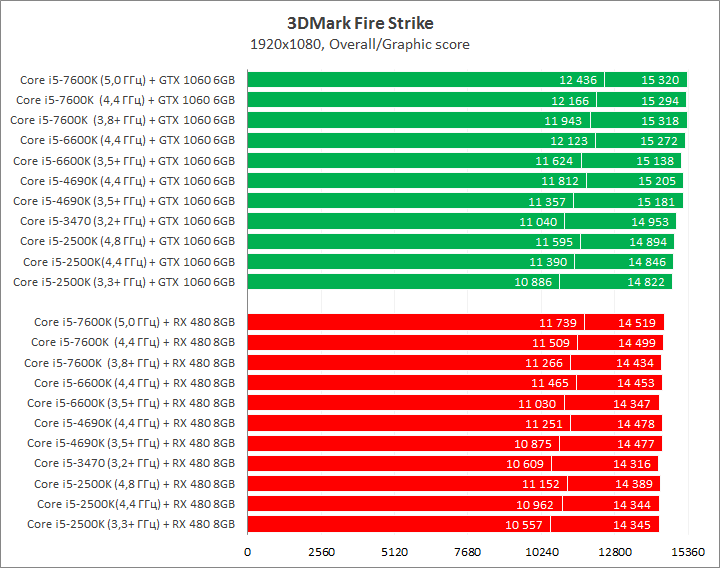
3DMark Fire Strike, being a fully synthetic test, showed no significant difference in performance between systems. We were primarily interested in the Graphic score, which is formed based on the results of subtests exclusively on the graphics core. For a video card from NVIDIA, the gap between first and last place is only three percent. For the Radeon accelerator it turned out to be even less - 1%.
Counter-Strike: Global Offensive

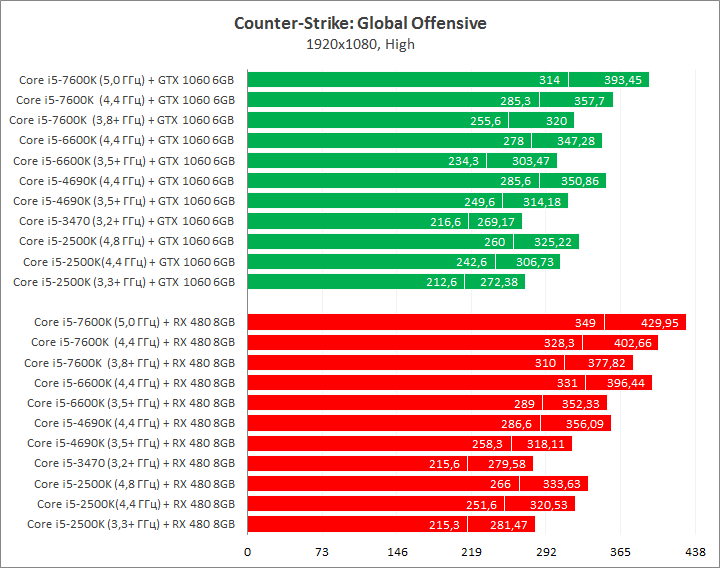
Gaming applications based on Valve's Source engine have always demonstrated a high level of frame rate dependence on the installed CPU. The graphs clearly show that a significant increase in fps is provided by both a higher frequency and an updated processor architecture. The situation is equally typical for video cards from both camps. The advantage of an overclocked Core i5-7600K over a Core i5-2500K is 20-28%; fixing the frequency at 4.4 GHz reduces the gap to 15-25%.
Dota 2

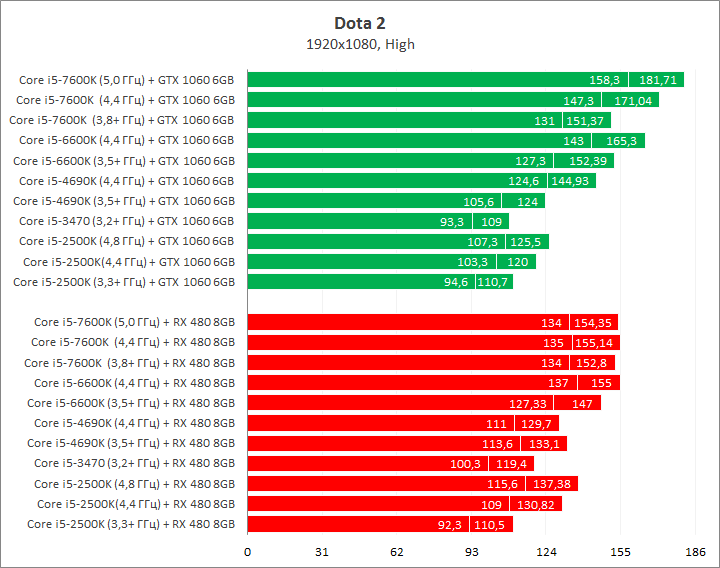
In Dota 2, you can observe differences in behavior between the GeForce GTX 1060 6GB and the Radeon RX 480 8GB. Starting with the Skylake architecture, the CPU frequency factor does not matter for the Radeon video card, while with the GeForce video card the number of fps continues to grow along with the growth of the available processor power. The gap between first and last place, depending on the installed video card, ranged from 44 to 71 frames per second, which can be considered a significant argument when deciding to upgrade the system, especially for owners of monitors with high screen refresh rates. In such a situation, computers based on Sandy Bridge and Ivy Bridge processors, and in some cases even Haswell, most likely will not be able to provide stable fps at the level required for comfortable gaming.
Battlefield 1

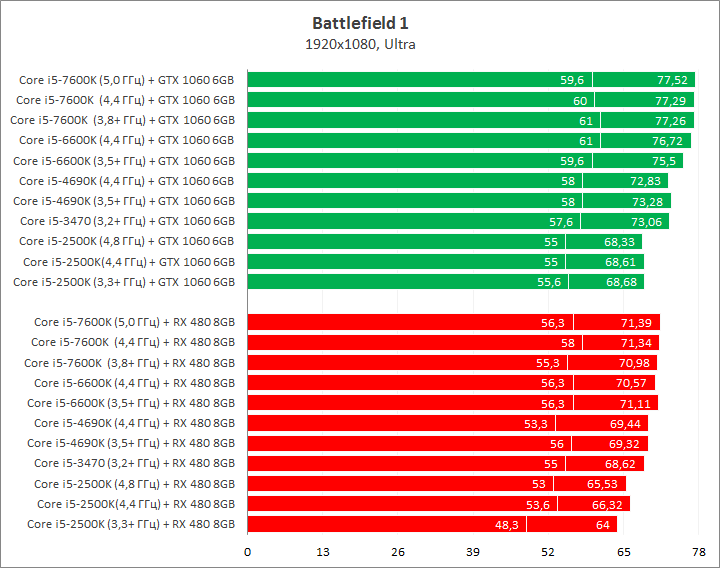
Using Battlefield 1 as an example, we would like to draw your attention to the fact that for certain modern games, it is the architecture of the CPU used that may come to the fore, and not the frequency at which it operates. In the green part of the graph, performance jumps from Sandy Bridge to Ivy Brigde / Haswell and further to Skylake / Kaby Lake are clearly visible. Overclocking the Core i5-2500K from 3.3 to 4.8 GHz, the same as Core overclocking i5-7600K from 3.8 to 5.0 GHz did not provide a single additional fps increase. This pattern is less typical for the Radeon RX 480 8GB video card, although the overclocking efficiency of the latter Intel processors here also tends to zero.
Call of Duty: Infinite Warfare

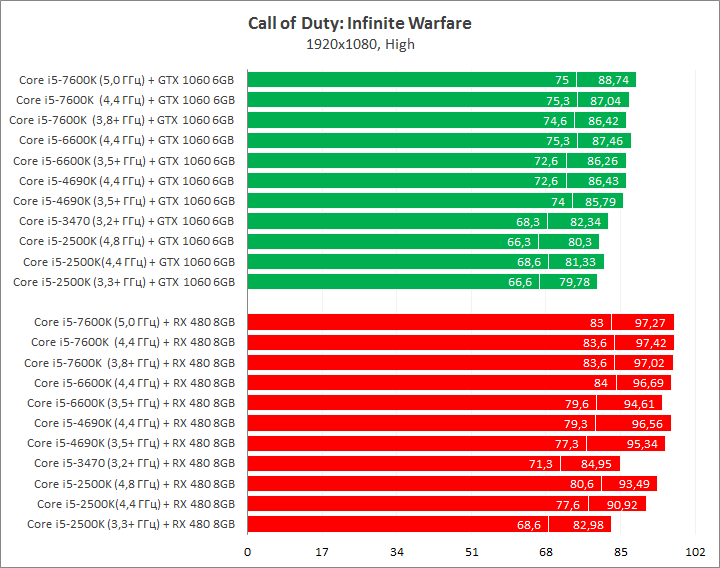
In Call of Duty: Infinite Warfare, to unlock the full potential of a mid-budget video card, a Haswell generation processor or newer will be enough, and there will be no need to resort to overclocking. The lag behind Sandy Bridge at the same clock frequency is 7%. In stock operating mode, the gap increases to 8-11%.
Deus Ex: Mankind Divided

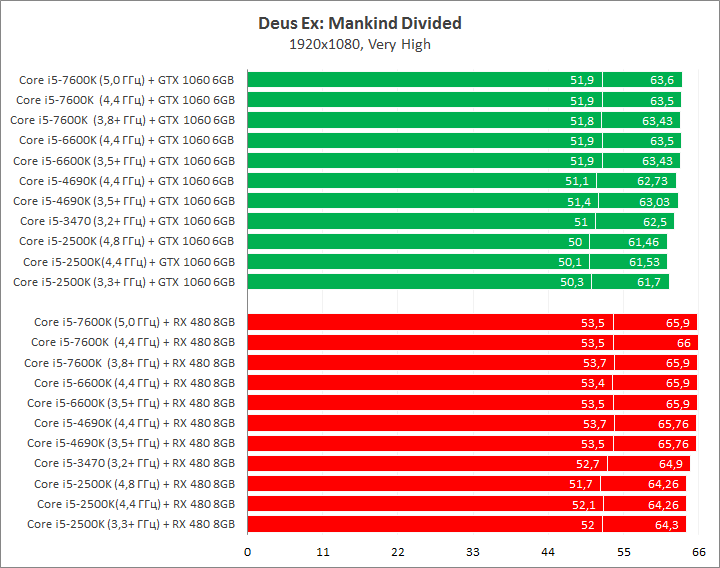
Deus Ex: Mankind Divided is not sensitive to the type of processor used, which resulted in a high density of final results. The maximum fps delta between systems is only 1-2 frames per second. Additional overclocking does not have a noticeable impact on overall performance in this application.
Far Cry Primal

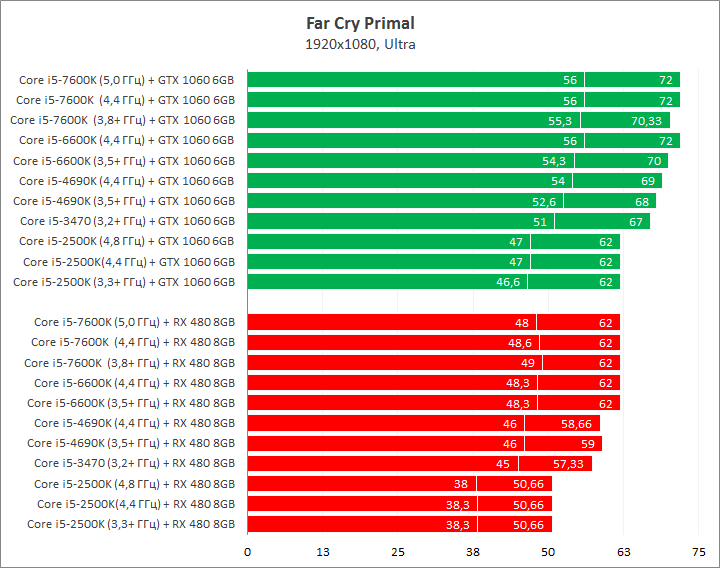
IN Far Cry Primal we again see a gradation in the graphs, depending on the architecture of the central processor. Interestingly, the performance level of the Core i5-3470, even at a lower clock frequency, turned out to be much higher than the Core i5-2500K overclocked to 4.8 GHz and came very close to the results of the Core i5-4690K. It seems that the optimization of games for old-timers of the Sandy Bridge generation has naturally begun to become obsolete. Starting with the CPU Core i5-6600K in nominal operating mode, the Radeon RX 480 8GB video card reached the limit of its capabilities, recording an average frame rate of 62 fps.
GTA V

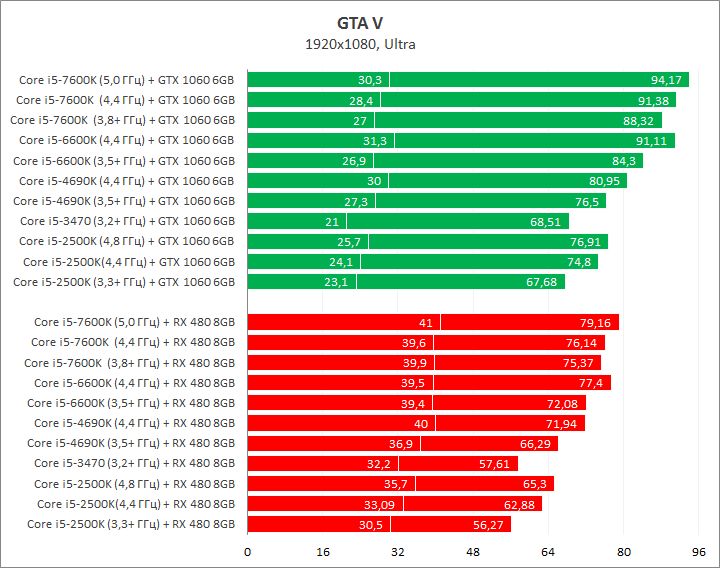
In GTA V, having a modern CPU operating at a higher clock speed is fully justified. As in the case of Counter-Strike: Global Offensive, both additional overclocking of the central processor and the updated architecture have a positive effect on the performance of the video card. A PC configuration based on Core i5-7600K / Core i5-6600K can provide a noticeable 17-19% handicap over older members of the Core i5 family.
Shadow Warrior 2

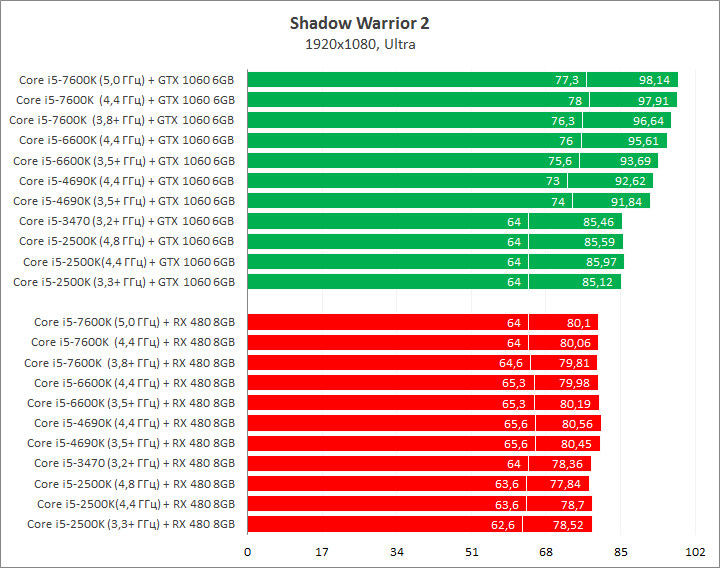
In Shadow Warrior 2, optimization technologies come first. At the same time, the difference in their operation depending on the manufacturer of the installed hardware is clearly visible. The Radeon video card demonstrated a very equal frame rate in all test combinations - delta fps no more than 2%. The results of the GeForce video card were divided into two blocks: 85 frames per second at the average fps frequency for the Core i5-2500K and Core i5-3470 processors (the Sandy Bridge / Ivy Bridge architecture clearly turned out to be the bottleneck) and the subsequent uniform performance increase on current CPU models .
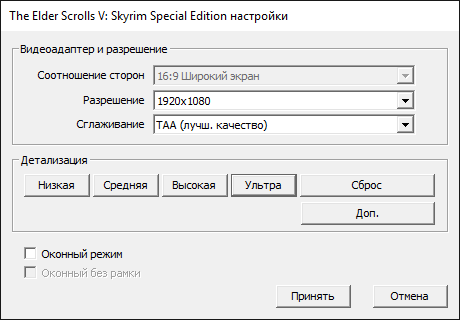
The Elder Scrolls V: Skyrim Special Edition
![]()
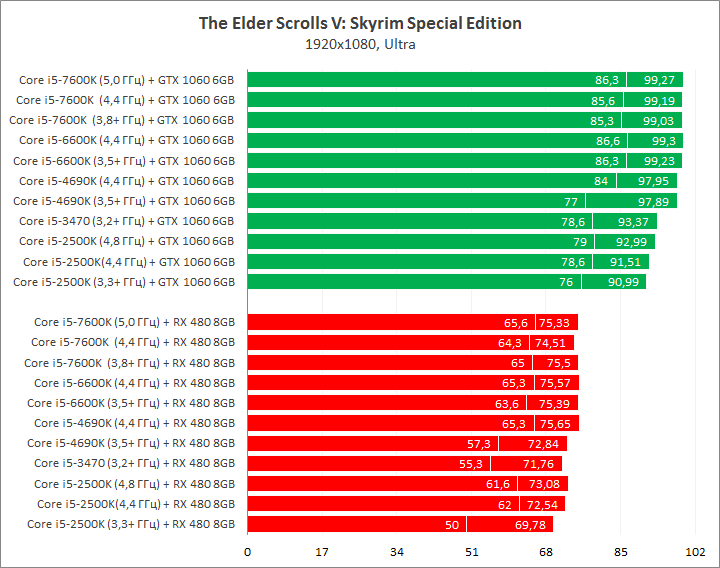
In The Elder Scrolls V: Skyrim Special Edition CPU advantage Haswell, Skylake, Kaby Lake is measured at 4-8%. The effectiveness of additional overclocking is low and can have a positive effect on some configurations only in terms of the minimum frame rate.
The Witcher 3: Wild Hunt

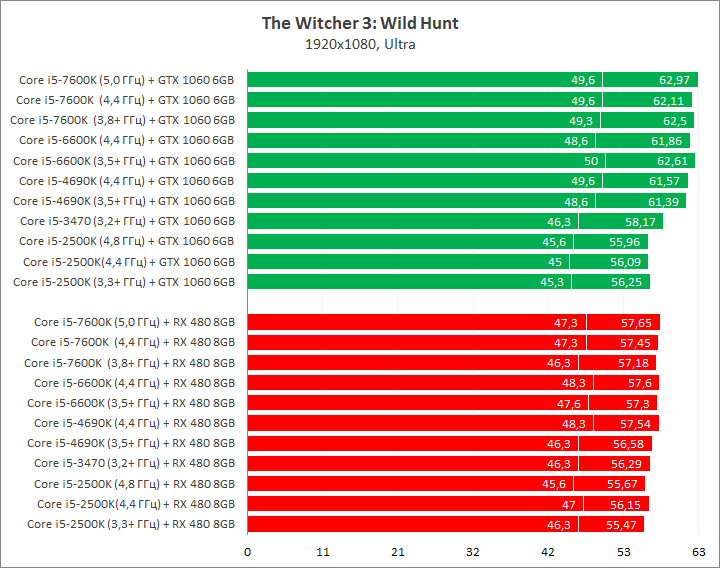
The Witcher 3: Wild Hunt is the fourth, but not the last, application where performance problems continued to plague the Core i5-2500K / Core i5-3470 processors, at least in conjunction with the GeForce GTX 1060 6GB video card. Installing a modern CPU itself provides an increase of an additional 5-6 fps, but what is more important is that this increase allows you to reach a comfortable level of 60 frames per second.
Watch Dogs 2

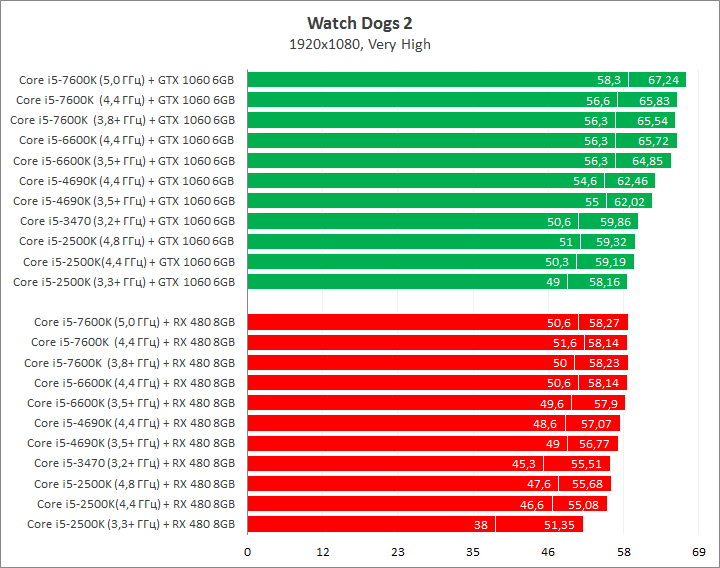
Watch Dogs 2 is a resource-intensive application that makes good use of the full potential of the power provided. Here the Skylake / Kaby Lake processors are the clear favorites, taking the lead by 13-14%. According to the graphs, additional overclocking brings benefits, but their level is so insignificant that it is unlikely to be noticeable to the user’s eye.
Analytics
Test results for a particular game will be useful if this game is your top priority. But in order to understand whether the time has come to think about upgrading your PC and which processor is best suited for this, you need to analyze the overall performance level of each of the tested combinations. For these purposes, a separate graph is displayed below, where the result of the Intel Core i5-7600K processor operating at the nominal frequency is taken as 100%. Thus, the difference between generations of processors and the effectiveness of their additional overclocking are clearly visible.
Total performance indicator

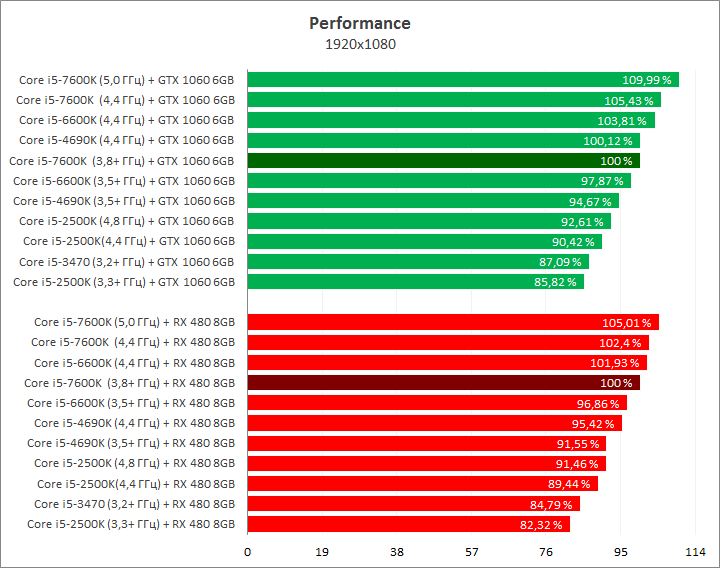
The best results, quite expectedly, were obtained on the Core i5-7600K central processor overclocked to 5 GHz. Boosting the clock frequency to the maximum allows you to increase PC performance in modern games by 5% when paired with a Radeon RX 480 8GB video card and by 10% when paired with a GeForce GTX 1060 6GB graphics accelerator. At equal frequencies, the Core i5-6600K and Core i5-7600K processors show the same level of performance, which indicates that switching from the Skylake generation to Generation Kaby Lake for the average user.
As for older generations of CPUs, models based on the Haswell and Haswell Refresh architectures remain quite relevant and, due to additional overclocking to 4.4 GHz, can compete with their older brothers at their nominal frequencies. The remaining Sandy Bride and Ivy Bridge processors are already more significant, and in this case, even a high overclock to 4.8 GHz does not save the situation - the advantage of the stock Core i5-7600K is measured by 8-9%.
Separately, it is worth noting that the Radeon video card turned out to be more demanding of the processor used. Performance drops relative to the reference were higher by a couple of percent for each test combination.
conclusions
We can say that over the past 6 years of evolution, during which Intel introduced as many as seven generations of Core i5 processors, the CPUs of the same name have taken a not so significant step forward, if the main situation for using a PC for you is computer games. Our testing showed that even taking into account high overclocking, the spread of results was within 20%. Video cards cover a similar path in just one generation. At the same time, today's test affected the mid-budget segment graphics accelerators, which means that the efficiency of older models of video cards of the current generation or the justification for a further upgrade to new GPUs will depend much more significantly on the computing power of the central processor used.
Owners of Core i5-2500K, Core i5-3470 and similar models can right now start updating their platform. Owners of Haswell and newer CPUs should resort to additional overclocking, which will allow them to calmly wait for new multi-core solutions to appear on the market, both from Intel and AMD, at affordable and reasonable prices. This step will simply help you save money or use it to improve other components of the system.
Returning to the Palit GeForce GTX 1060 Jetstream 6GB video card, which became one of the direct heroes of the reviews, after passing many hours of tests it has established itself as quiet and effective solution at an affordable price. Their advantages include the high overclocking potential of video memory and overclocking of the video core, which is typical for all members of the GeForce GTX 1060 family. If you belong to the advanced category of users and know how to overclock a video card yourself, then you definitely shouldn’t overpay for the Super Jetstream version.
One, two, eight, ten - no matter how many cores you add, it will still not be enough. Why do manufacturers confidently increase quantity, forgetting about quality? However, everyone claims that the main improvements are taking place in the CPU architecture, but how significant are they?
It just so happened that we had practically not tested this difference before, because the process itself is very long and requires the presence of a large number of components at the same time. It’s time to correct this omission by presenting you real performance processors of five generations operating at the same frequency and under the same conditions. To do this, let's take four representatives from Intel and don't forget about the opponent from AMD.
From the Intel camp, the participants will include Core i7-4930K on Ivy Bridge-E architecture, Core i7-5960X on Haswell-E architecture, Core i7-6950X on Broadwell-E architecture and Core i7-6700K on Skylake architecture. Well, they will be accompanied by the AMD FX-8370E based on the Vishera architecture, which is taking part in the test for objectivity.
All these processors are somewhat similar, but there are also global differences. Thus, Vishera and Ivy Bridge-E support DDR3 memory, and the latter does this in quad-channel mode. The rest work with DDR4 memory. We tried to bring memory frequencies as close as possible, and therefore in the case of DDR4 platforms a frequency of 2133 MHz will be used.
Note that unlike Vishera, which easily survived high-frequency DDR3 memory, Ivy Bridge-E resisted, and the maximum we squeezed out of it was 1866 MHz. The difference in frequencies was compensated by timings.
Test configurations
Test bench No. 1
- Motherboard: ASUS Hero VIII (Intel Z170, LGA 1151);
- RAM: 2 x 8 GB, 2133 MHz, 15-15-15-36-1T;
The Intel Core i7-6700K used in the review appears in three modes:
- Intel i7-6700K 1C0H (one active core without HT);
- Intel i7-6700K 1C1H (one active core with HT);
- Intel i7-6700K 2C0H (two active cores without HT).
Test bench No. 2
- Motherboard: ASUS Rampage IV Black Edition (Intel X79, LGA 2011);
- Cooling system: water cooling system;
- Thermal interface: Arctic Cooling MX-2;
- RAM: 4 x 4 GB, 1866 MHz, 9-10-9-27-1T;
- Hard drive: Seagate Barracuda 2 TB;
- SSD drive: Corsair Neutron GTX 240 GB;
- Video card: AMD Radeon R9 Fury X;
- Power supply: Corsair AX1500i 1500 Watt;
- Operating system: Microsoft Windows 10 x64.
Processor and its operating modes
The Intel Core i7-4930K used in the review appears in three modes:
- Intel i7-4930K 1C0H (one active core without HT);
- Intel i7-4930K 1C1H (one active core with HT);
- Intel i7-4930K 2C0H (two active cores without HT).
Test bench No. 3
- Motherboard: ASUS X99-Deluxe II (Intel X99, LGA 2011-3);
- Cooling system: water cooling system;
- Thermal interface: Arctic Cooling MX-2;
- RAM: 4 x 4 GB, 2133 MHz, 15-15-15-36-1T;
- Hard drive: Seagate Barracuda 2 TB;
- SSD drive: Corsair Neutron GTX 240 GB;
- Video card: AMD Radeon R9 Fury X;
- Power supply: Corsair AX1500i 1500 Watt;
- Operating system: Microsoft Windows 10 x64.
Processors and their operating modes
![]()
The Intel Core i7-5960X used in the review appears in three modes:
- Intel i7-5960X 1C0H (one active core without HT);
- Intel i7-5960X 1C1H (one active core with HT);
- Intel i7-5960X 2C0H (two active cores without HT).
The Intel Core i7-6950X used in the review appears in three modes:
- Intel i7-6950X 1C0H (one active core without HT);
- Intel i7-6950X 1C1H (one active core with HT);
- Intel i7-6950X 2C0H (two active cores without HT).
Test bench No. 4
- Motherboard: MSI 970 Gaming (AMD 970, AM3+);
- Cooling system: water cooling system;
- Thermal interface: Arctic Cooling MX-2;
- RAM: 2 x 8 GB, 2133 MHz, 10-12-12-31-1T;
- Hard drive: Seagate Barracuda 2 TB;
- SSD drive: Corsair Neutron GTX 240 GB;
- Video card: AMD Radeon R9 Fury X;
- Power supply: Corsair AX1500i 1500 Watt;
- Operating system: Microsoft Windows 10 x64.
Processor and its operating modes
The AMD FX-8370E used in the review appears in one mode:
- AMD FX-8370 2C0H (two active cores).
Since the AMD processor cannot turn off cores independently, we had to use one active unit consisting of two cores. In reality, this configuration is similar to one Intel CPU core enabled plus active Hyper-Threading (in other words, the AMD CPU does not count in the 1C1H category).
Testing tools and methodology
It is worth talking a little about the programs used in testing and the reasons for their choice.
WinRAR x64– built-in performance test is used. The program itself is located on a disk partition located on an SSD drive, thereby eliminating the low performance of a classic HDD. The test result is the average value obtained after three runs of the program. WinRAR appears in this review for a reason, because we often have to download and unpack files. Moreover, RAR is very common among archivers and supports multithreading well.
Java Micro Benchmark. An atypical test among processor reviews, which allows you to compare system performance indicators on different platforms. The result for comparison is taken from the Arithmetic operations category.
XnView– a common program for viewing photographic material. It's free and easy to use. Additionally, it has built-in simple functions for converting formats, making changes, and more. We are interested in the time during which the program will make changes and save thirty-five NEF files. The typical requirements of an amateur photographer are presented: changing the color balance, changing the temperature, leveling the horizon, removing the bulge, adding sharpness, changing the size to 1900 pixels on the larger side. The test itself is designed for only a couple of cores, but the new instructions have a very good effect on the operation of the program. In other words, the newer the architecture and the higher the core frequency, the faster the test runs.
Adobe Photoshop CC 2015. The test result is the time it takes to apply filters to one 50 megapixel image. Standard filters and operations are applied: resizing, gamma settings, etc. Quite a typical set for the program. Unlike video encoding, Photoshop never became multi-threaded; rather, it can be called a moderately CPU-intensive program. The built-in video core is disabled. This was done due to the inoperability of the Intel and AMD libraries.
Cinebench R15. A common CPU test in rendering.
Adobe Media Encoder CC 2015– a video converter that allows you to work with 4K video. The task is to transcode 4K video into the format of a ready-made YouTube HD 1080P 29.97 preset. Input video format: MPEG-4, Base Media / Version 2 format profile, file size 1.68 GB, constant bitrate 125 Mbps, format profile [email protected], video resolution 3840 x 2160 pixels, frame number 29.970 fps.
X265 1.5+448 8bpp X64– testing the speed of video transcoding into the promising H.265/HEVC format.
Adobe InDesign CC 2015– output of 56-page layout material with photographs in NEF format into PDF 1.7 format of printing quality.
Hexus PiFast– a test similar to SuperPI. The essence of the work is to count the number “pi” to a certain sign.
Corona 1.3 Benchmark is a rendering system developed by an enthusiast. Currently in beta testing. The benchmark uses an unchangeable set of settings.
SVPmark– system performance test when working with the SmoothVideo Project (SVP) package, using real algorithms and parameters used in SVP 3.0 for testing.
Geekbench 3– a cross-platform test for measuring the speed of a computer’s processor and memory subsystem.
Details and results of each test
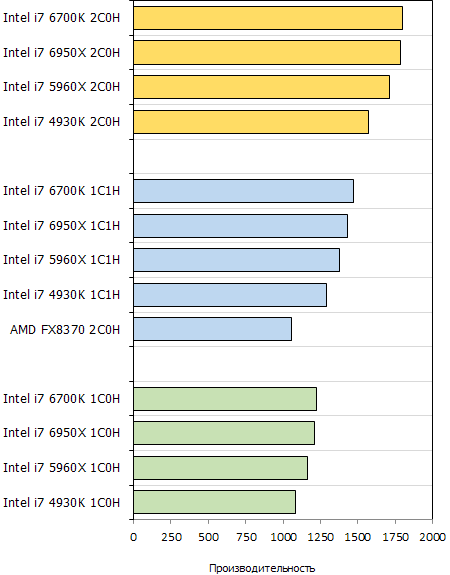
Explanation of operating modes:
- 1C0H – one active core without Hyper-Threading;
- 1C1H – one active core with Hyper-Threading;
- 2C0H – two active cores without Hyper-Threading.
Indeed, over the past time Intel company gradually increased the specific performance per core. On average, over four generations the increase was 14%. And the biggest leap occurred when the Ivy Bridge architecture changed from DDR3 memory to Haswell-E with DDR4.
As for the usefulness of Hyper-Threading technology, in the vast majority of tests it has obvious advantages, since when using it, the speed increases by 18-20%. Of course, it is not able to simulate a full-fledged second processor core, which, by the way, gives from 45 to 48% increase in performance.
And one more important point - a growing number of cores does not always have a linear effect on the results. So far we have only tested simple configurations with one or two CPU cores enabled, with and without NT. This was done in order to understand how increasing computational units affects overall performance, and also to show that AMD processors still able to hold its own against Intel due to its attractive pricing. AMD would have announced initially Vishera as a quad-core CPU with Double Core technology (analogous to HT Intel), and there would be fewer questions for the company.
Dmitry Vladimirovich

We would like to express our gratitude for their assistance in preparing the material:
- Companies Intel, AMD And ASUS for components provided for testing.
- And also personally donnerjack
Introduction
This summer, Intel did something strange: it managed to change as many as two generations of processors aimed at commonly used personal computers. At first, Haswell was replaced by processors with the Broadwell microarchitecture, but then within just a couple of months they lost their status as new products and gave way to Skylake processors, which will remain the most progressive CPUs for at least another year and a half. This leapfrog with the change of generations occurred mainly in connection with the problems Intel encountered when introducing the new 14-nm process technology, which is used in the production of both Broadwell and Skylake. Productive carriers of the Broadwell microarchitecture were greatly delayed on their way to desktop systems, and their successors were released according to a pre-planned schedule, which led to a crumpled announcement of the fifth generation Core processors and a serious reduction in their life cycle. As a result of all these upheavals, in the desktop segment Broadwell occupied a very narrow niche of economical processors with a powerful graphics core and are now content with only a small level of sales typical of highly specialized products. The attention of the advanced part of users switched to the followers of Broadwell - Skylake processors.
It should be noted that over the past few years, Intel has not been pleasing its fans with the growth in performance of its products. Each new generation of processors adds only a few percent in specific performance, which ultimately leads to a lack of clear incentives for users to upgrade older systems. But the release of Skylake - a generation of CPUs along the way to which Intel actually jumped over a step - inspired certain hopes that we would get a truly worthwhile update to the most common computing platform. However, nothing like this happened: Intel performed in its usual repertoire. Broadwell was introduced to the public as a sort of offshoot from the main line of desktop processors, and Skylake turned out to be marginally faster than Haswell in most applications.
Therefore, despite all expectations, the appearance of Skylake on sale aroused skepticism among many. After reviewing the results of real tests, many buyers simply did not see the real point in switching to sixth-generation Core processors. Indeed, the main trump card of the new CPUs is primarily a new platform with accelerated internal interfaces, but not a new processor microarchitecture. And this means that Skylake offers few real incentives to update legacy systems.
However, we still would not dissuade all users without exception from switching to Skylake. The fact is that even though Intel is increasing the performance of its processors at a very restrained pace, four generations of microarchitecture have already passed since the advent of Sandy Bridge, which are still working in many systems. Each step along the path of progress has contributed to an increase in performance, and today Skylake is able to offer quite a significant increase in performance compared to its earlier predecessors. Just to see this, you need to compare it not with Haswell, but with earlier representatives of the Core family that appeared before it.
Actually, this is exactly the comparison we will do today. Considering all that has been said, we decided to see how much the performance of Core i7 processors has increased since 2011, and we collected older Core i7s belonging to the Sandy Bridge, Ivy Bridge, Haswell, Broadwell and Skylake generations in a single test. Having received the results of such testing, we will try to understand which processor owners should start upgrading older systems, and which of them can wait until subsequent generations of CPUs appear. Along the way, we will look at the performance level of the new Core i7-5775C and Core i7-6700K processors of the Broadwell and Skylake generations, which have not yet been tested in our laboratory.
Comparative characteristics of the tested CPUs
From Sandy Bridge to Skylake: Specific Performance Comparison
In order to remember how the specific performance of Intel processors has changed over the last five years, we decided to start with a simple test in which we compared the operating speed of Sandy Bridge, Ivy Bridge, Haswell, Broadwell and Skylake, reduced to the same frequency 4 .0 GHz. In this comparison we used processors Core line i7, that is, quad-core processors with Hyper-Threading technology.
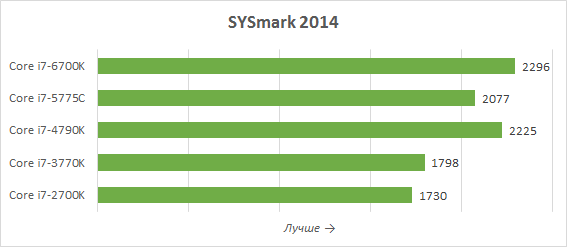
The complex test SYSmark 2014 1.5 was taken as the main testing tool, which is good because it reproduces typical user activity in common office applications, when creating and processing multimedia content and when solving computing problems. The following graphs display the results obtained. For ease of perception, they are normalized; the performance of Sandy Bridge is taken as 100 percent.
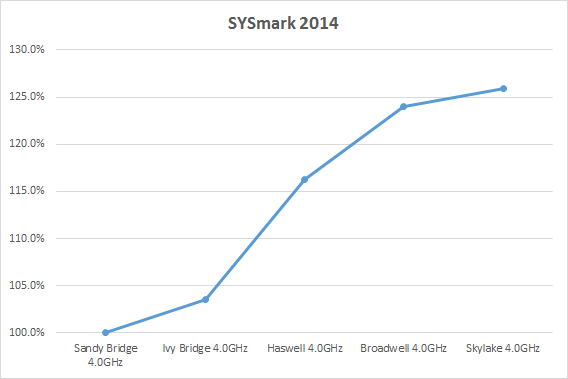
The integral indicator SYSmark 2014 1.5 allows us to make the following observations. The transition from Sandy Bridge to Ivy Bridge increased specific productivity only slightly - by about 3-4 percent. The next step to Haswell was much more effective, resulting in a 12 percent improvement in performance. And this is the maximum increase that can be observed in the above graph. After all, Broadwell is ahead of Haswell by only 7 percent, and the transition from Broadwell to Skylake even increases specific productivity by only 1-2 percent. All the progress from Sandy Bridge to Skylake results in a 26 percent increase in performance at constant clock speeds.
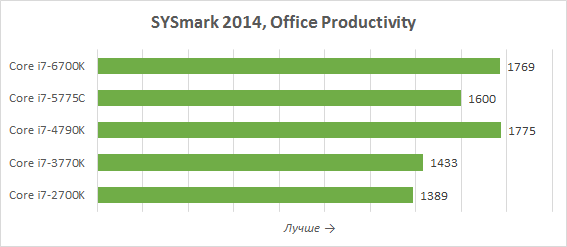
A more detailed explanation of the obtained SYSmark 2014 1.5 indicators can be found in the following three graphs, where the integral performance index is broken down into components by application type.
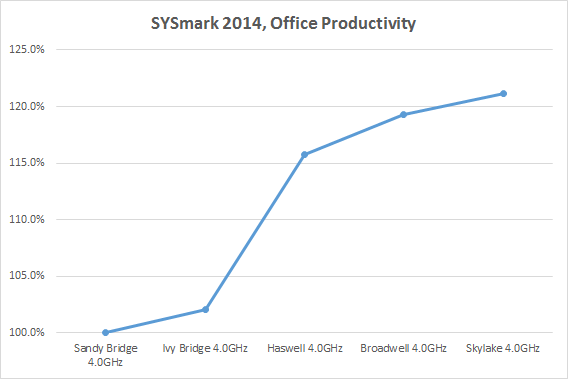
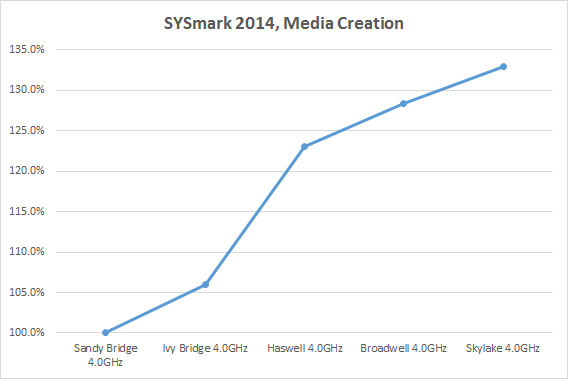
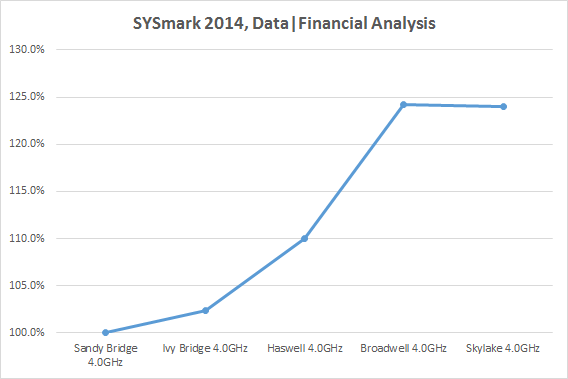
Please note that with the introduction of new versions of microarchitectures, multimedia applications increase execution speed most noticeably. In them, the Skylake microarchitecture outperforms Sandy Bridge by as much as 33 percent. But in counting problems, on the contrary, progress is least evident. Moreover, with such a load, the step from Broadwell to Skylake even results in a slight decrease in specific performance.
Now that we have an idea of what has happened to the specific performance of Intel processors over the past few years, let's try to figure out what caused the observed changes.
From Sandy Bridge to Skylake: what has changed in Intel processors
We decided to make the representative of the Sandy Bridge generation the starting point for comparing different Core i7s for a reason. It was this design that laid a strong foundation for all further improvements in high-performance Intel processors up to today's Skylake. Thus, representatives of the Sandy Bridge family became the first highly integrated CPUs, in which both computing and graphics cores were assembled in one semiconductor chip, as well as north bridge with L3 cache and memory controller. In addition, they were the first to use an internal ring bus, through which the problem of highly efficient interaction of all structural units that make up such a complex processor was solved. These universal design principles embedded in the Sandy Bridge microarchitecture continue to be followed by all subsequent generations of CPUs without any major adjustments.
The internal microarchitecture of the computing cores has undergone significant changes in Sandy Bridge. It not only implemented support for the new AES-NI and AVX instruction sets, but also found numerous major improvements in the bowels of the execution pipeline. It was in Sandy Bridge that a separate level-0 cache was added for decoded instructions; appeared absolutely new block instruction reordering based on the use of a physical register file; Branch prediction algorithms have been significantly improved; and in addition, two of the three execution ports for working with data have become unified. Such diverse reforms, carried out simultaneously at all stages of the pipeline, made it possible to significantly increase the specific productivity of Sandy Bridge, which immediately increased by almost 15 percent compared to the previous generation Nehalem processors. Added to this was a 15% increase in nominal clock frequencies and excellent overclocking potential, resulting in a family of processors that is still held up by Intel as an exemplary embodiment of the “so” phase in the company’s pendulum development concept.
Indeed, we have not seen improvements in microarchitecture similar in scale and effectiveness since Sandy Bridge. All subsequent generations of processor designs make much smaller improvements in the computing cores. Perhaps this is a reflection of the lack of real competition in the processor market, perhaps the reason for the slowdown in progress lies in Intel's desire to focus on improving graphics cores, or perhaps Sandy Bridge simply turned out to be such a successful project that it further development requires too much labor.
The transition from Sandy Bridge to Ivy Bridge perfectly illustrates the decline in innovation intensity. Despite the fact that the next generation of processors after Sandy Bridge was transferred to a new production technology with 22 nm standards, its clock speeds did not increase at all. The improvements made in the design mainly affected the memory controller, which became more flexible, and the PCI Express bus controller, which became compatible with the third version of this standard. As for the microarchitecture of the computing cores itself, some cosmetic changes made it possible to speed up the execution of division operations and slightly increase the efficiency of Hyper-Threading technology, and that’s all. As a result, the increase in specific productivity was no more than 5 percent.
At the same time, the introduction of Ivy Bridge also brought something that the million-strong army of overclockers now bitterly regrets. Starting with processors of this generation, Intel abandoned the pairing of the semiconductor chip of the CPU and the cover that covers it using flux-free soldering and switched to filling the space between them with a polymer thermal interface material with very dubious thermal conductive properties. This artificially worsened the frequency potential and made Ivy Bridge processors, like all their successors, noticeably less overclockable compared to the very vigorous “oldies” Sandy Bridge in this regard.
However, Ivy Bridge is just a “tick”, and therefore no one promised any special breakthroughs in these processors. However, the next generation, Haswell, which, unlike Ivy Bridge, already belongs to the “so” phase, did not bring any encouraging growth in productivity. And this is actually a little strange, since a lot of various improvements have been made in the Haswell microarchitecture, and they are dispersed across different parts of the execution pipeline, which in total could well increase the overall speed of command execution.
For example, in the input part of the pipeline, the performance of branch prediction was improved, and the queue of decoded instructions began to be dynamically divided between parallel threads coexisting within the Hyper-Threading technology. At the same time, there was an increase in the window for out-of-order execution of commands, which in total should have increased the share of code executed in parallel by the processor. Two additional functional ports were added directly to the execution unit, aimed at processing integer commands, servicing branches and storing data. Thanks to this, Haswell became capable of processing up to eight micro-operations per clock cycle - a third more than its predecessors. Moreover, the new microarchitecture doubles and throughput cache memory of the first and second levels.
Thus, improvements in the Haswell microarchitecture did not affect only the speed of the decoder, which, it seems, has currently become the bottleneck in modern processors Core. Indeed, despite the impressive list of improvements, the increase in specific productivity for Haswell compared to Ivy Bridge was only about 5-10 percent. But in fairness, it must be noted that in vector operations the acceleration is noticeably much stronger. And the greatest gains can be seen in applications that use the new AVX2 and FMA commands, support for which also appeared in this microarchitecture.
Haswell processors, like Ivy Bridge, were also not particularly liked by enthusiasts at first. Especially considering the fact that in the original version they did not offer any increase in clock frequencies. However, a year after its debut, Haswell began to seem noticeably more attractive. First, there has been an increase in the number of applications that take advantage of the architecture's greatest strengths and use vector instructions. Secondly, Intel was able to correct the situation with frequencies. Later modifications of Haswell, codenamed Devil's Canyon, were able to increase their advantage over their predecessors by increasing the clock speed, which finally broke through the 4-GHz ceiling. In addition, following the lead of overclockers, Intel has improved the polymer thermal interface under the processor cover, which makes Devil's Canyon more suitable for overclocking. Of course, not as pliable as Sandy Bridge, but still.
And with such baggage, Intel approached Broadwell. Since the main key feature These processors were supposed to be a new production technology with 14 nm standards; no significant innovations in their microarchitecture were planned - it was supposed to be almost the most banal “tick”. Everything necessary for the success of new products could well be provided by just one thin technical process with second-generation FinFET transistors, which in theory allows reducing power consumption and raising frequencies. However, practical implementation new technology turned into a series of failures, as a result of which Broadwell got only efficiency, but not high frequencies. As a result, those processors of this generation that Intel introduced for desktop systems came out more like mobile CPUs than successors to Devil’s Canyon. Moreover, in addition to reduced thermal packages and rolled back frequencies, they differ from their predecessors in having a smaller L3 cache, which, however, is somewhat compensated by the appearance of a fourth-level cache located on a separate chip.
At the same frequency as Haswell, Broadwell processors demonstrate approximately a 7 percent advantage, provided by both the addition of an additional level of data caching and another improvement in the branch prediction algorithm along with an increase in the main internal buffers. In addition, Broadwell implements new and faster schemes for executing multiply and divide instructions. However, all these small improvements are canceled out by the fiasco with clock frequencies, taking us to the era before Sandy Bridge. For example, the older overclocker Core i7-5775C of the Broadwell generation is inferior in Core frequency i7-4790K as much as 700 MHz. It is clear that it is pointless to expect any increase in productivity against this background, as long as there is no serious drop in productivity.
Largely because of this, Broadwell turned out to be unattractive to the majority of users. Yes, processors of this family are highly economical and even fit into a thermal package with a 65-watt frame, but who really cares about that? The overclocking potential of the first generation 14nm CPU turned out to be quite restrained. There is no talk of any operation at frequencies approaching the 5-GHz bar. The maximum that can be achieved from Broadwell using air cooling lies in the vicinity of 4.2 GHz. In other words, Intel's fifth generation Core turned out to be, at least, strange. Which, by the way, the microprocessor giant eventually regretted: Intel representatives note that the late release of Broadwell for desktop computers, its abbreviation life cycle and atypical characteristics had a negative impact on sales, and the company does not plan to undertake any more such experiments.
Against this background, the newest Skylake appears not so much as a further development of Intel microarchitecture, but as a kind of work on mistakes. Despite the fact that this generation of CPU uses the same 14nm process technology as Broadwell, Skylake does not have any problems with operating at high frequencies. The nominal frequencies of the sixth generation Core processors have returned to those that were characteristic of their 22-nm predecessors, and the overclocking potential has even increased slightly. The fact that in Skylake the processor power converter again migrated to motherboard and thereby reduced the total heat generation of the CPU during overclocking. The only pity is that Intel never returned to using an effective thermal interface between the die and the processor cover.
But as for the basic microarchitecture of computing cores, despite the fact that Skylake, like Haswell, is the embodiment of the “so” phase, there are very few innovations in it. Moreover, most of them are aimed at expanding the input part of the executive pipeline, while the remaining parts of the pipeline remained without any significant changes. The changes relate to improving the performance of branch prediction and increasing the efficiency of the prefetch unit, and that’s all. At the same time, some of the optimizations serve not so much to improve performance, but are aimed at further increasing energy efficiency. Therefore, one should not be surprised that Skylake is almost no different from Broadwell in its specific performance.
However, there are exceptions: in some cases, Skylake can outperform its predecessors in performance and more noticeably. The fact is that the memory subsystem has been improved in this microarchitecture. The on-chip ring bus became faster, and this ultimately increased the bandwidth of the L3 cache. Plus, the memory controller received support for high-frequency DDR4 SDRAM memory.
But in the end, it turns out, no matter what Intel says about the progressiveness of Skylake, from the point of view ordinary users This is a rather weak update. The main improvements in Skylake are made in the graphics core and in energy efficiency, which opens the way for such CPUs to fanless systems of the tablet form factor. Desktop representatives of this generation do not differ too noticeably from those of Haswell. Even if we close our eyes to the existence of the intermediate generation Broadwell, and compare Skylake directly with Haswell, the observed increase in specific productivity will be about 7-8 percent, which can hardly be called an impressive manifestation of technical progress.
Along the way, it is worth noting that the improvement of technological production processes does not live up to expectations. On the way from Sandy Bridge to Skylake, Intel changed two semiconductor technologies and reduced the thickness of transistor gates by more than half. However, the modern 14-nm process technology, compared to the 32-nm technology of five years ago, has not made it possible to increase the operating frequencies of processors. All Core processors of the last five generations have very similar clock speeds, which, if they exceed the 4-GHz mark, are very small.
To clearly illustrate this fact, you can look at the following graph, which displays the clock speed of older overclocking Core i7 processors of different generations.
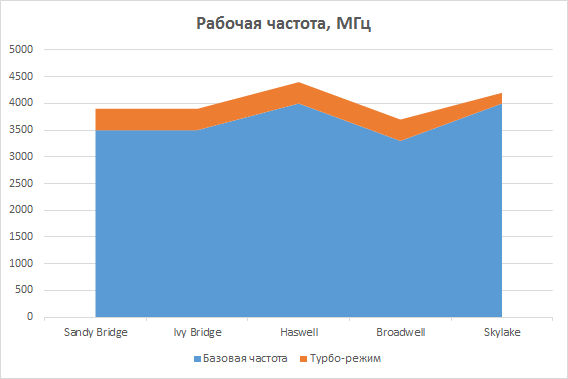
Moreover, the peak clock speed does not even occur on Skylake. They can boast of the maximum frequency Haswell processors, belonging to the Devil's Canyon subgroup. Their nominal frequency is 4.0 GHz, but thanks to the turbo mode in real conditions they are capable of accelerating to 4.4 GHz. For modern Skylake, the maximum frequency is only 4.2 GHz.
All this, naturally, affects the final performance of real representatives of various CPU families. And then we propose to see how all this is reflected in the performance of platforms built on the basis of flagship processors from each of the Sandy Bridge, Ivy Bridge, Haswell, Broadwell and Skylake families.
How we tested
The comparison involved five Core i7 processors of different generations: Core i7-2700K, Core i7-3770K, Core i7-4790K, Core i7-5775C and Core i7-6700K. Therefore, the list of components involved in testing turned out to be quite extensive:
Processors:
Intel Core i7-2600K (Sandy Bridge, 4 cores + HT, 3.4-3.8 GHz, 8 MB L3);
Intel Core i7-3770K (Ivy Bridge, 4 cores + HT, 3.5-3.9 GHz, 8 MB L3);
Intel Core i7-4790K (Haswell Refresh, 4 cores + HT, 4.0-4.4 GHz, 8 MB L3);
Intel Core i7-5775C (Broadwell, 4 cores, 3.3-3.7 GHz, 6 MB L3, 128 MB L4).
Intel Core i7-6700K (Skylake, 4 cores, 4.0-4.2 GHz, 8 MB L3).
CPU cooler: Noctua NH-U14S.
Motherboards:
ASUS Z170 Pro Gaming (LGA 1151, Intel Z170);
ASUS Z97-Pro (LGA 1150, Intel Z97);
ASUS P8Z77-V Deluxe (LGA1155, Intel Z77).
Memory:
2x8 GB DDR3-2133 SDRAM, 9-11-11-31 (G.Skill F3-2133C9D-16GTX);
2x8 GB DDR4-2666 SDRAM, 15-15-15-35 (Corsair Vengeance LPX CMK16GX4M2A2666C16R).
Video card: NVIDIA GeForce GTX 980 Ti (6 GB/384-bit GDDR5, 1000-1076/7010 MHz).
Disk subsystem: Kingston HyperX Savage 480 GB (SHSS37A/480G).
Power supply: Corsair RM850i (80 Plus Gold, 850 W).
Testing was performed in the operating room Microsoft system Windows 10 Enterprise Build 10240 using the following driver set:
Intel Chipset Driver 10.1.1.8;
Intel Management Engine Interface Driver 11.0.0.1157;
NVIDIA GeForce 358.50 Driver.
Performance
Overall Performance
To evaluate processor performance in common tasks, we traditionally use test package Bapco SYSmark, which simulates the user's work in real common modern office programs and applications for creating and processing digital content. The idea of the test is very simple: it produces a single metric characterizing the weighted average speed of the computer during everyday use. After release operating system Windows 10 this benchmark has been updated once again, and now we use the most latest version– SYSmark 2014 1.5.
At Core comparison i7 of different generations, when they operate in their nominal modes, the results are completely different from those when compared at a single clock frequency. Still, the actual frequency and operating features of the turbo mode have a fairly significant impact on performance. For example, according to the data obtained, the Core i7-6700K is faster than the Core i7-5775C by as much as 11 percent, but its advantage over the Core i7-4790K is very insignificant - it is only about 3 percent. At the same time, we cannot ignore the fact that the newest Skylake turns out to be significantly faster than processors Sandy generations Bridge and Ivy Bridge. Its advantage over the Core i7-2700K and Core i7-3770K reaches 33 and 28 percent, respectively.
A deeper understanding of the SYSmark 2014 1.5 results can be provided by familiarizing yourself with the performance estimates obtained in various system usage scenarios. The Office Productivity scenario simulates typical office work: preparing text, processing spreadsheets, working with by email and visiting Internet sites. The script uses the following set of applications: Adobe Acrobat XI Pro, Google Chrome 32, Microsoft Excel 2013, Microsoft OneNote 2013, Microsoft Outlook 2013, Microsoft PowerPoint 2013, Microsoft Word 2013, WinZip Pro 17.5 Pro.
The Media Creation scenario simulates the creation of a commercial using pre-shot digital images and videos. For this purpose, the popular Adobe Photoshop CS6 Extended packages are used, Adobe Premiere Pro CS6 and Trimble SketchUp Pro 2013.
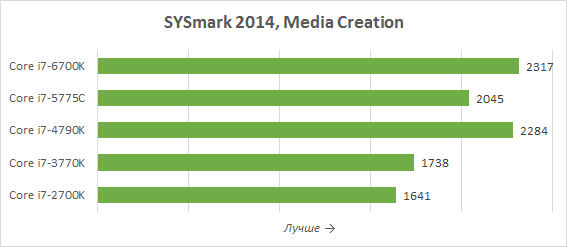
The Data/Financial Analysis scenario is devoted to statistical analysis and investment forecasting based on a certain financial model. The scenario uses large amounts of numerical data and two Microsoft applications Excel 2013 and WinZip Pro 17.5 Pro.
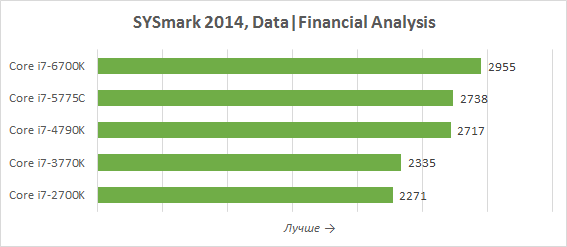
The results we obtained under various load scenarios qualitatively repeat the general indicators of SYSmark 2014 1.5. The only noteworthy fact is that the Core i7-4790K processor does not look outdated at all. It noticeably loses to the latest Core i7-6700K only in the Data/Financial Analysis calculation scenario, and in other cases it is either inferior to its successor by a very insignificant amount, or is generally faster. For example, a representative of the Haswell family is ahead of the new Skylake in office applications. But the older processors, Core i7-2700K and Core i7-3770K, already look like somewhat outdated offerings. They lose to the new product in different types tasks from 25 to 40 percent, and this is perhaps quite sufficient reason for the Core i7-6700K to be considered as a worthy replacement.
Gaming Performance
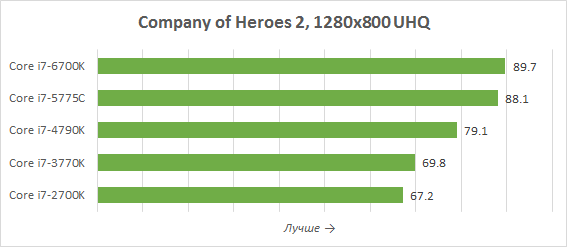
As you know, the performance of platforms equipped with high-performance processors in the vast majority of modern games is determined by the power of the graphics subsystem. That is why, when testing processors, we select the most processor-dependent games, and measure the number of frames twice. The first pass tests are carried out without turning on anti-aliasing and with settings that are far from the highest. Such settings allow you to evaluate how well processors perform with a gaming load in principle, and therefore allow you to speculate about how the tested computing platforms will behave in the future, when faster options for graphics accelerators appear on the market. The second pass is performed with realistic settings - when selecting FullHD resolution and the maximum level of full-screen anti-aliasing. In our opinion, such results are no less interesting, since they answer the frequently asked question about what level of gaming performance processors can provide right now - in modern conditions.
However, in this testing we assembled a powerful graphics subsystem based on the flagship NVIDIA video card GeForce GTX 980 Ti. And as a result, in some games the frame rate showed a dependence on processor performance, even in FullHD resolution.
Results in FullHD resolution with maximum quality settings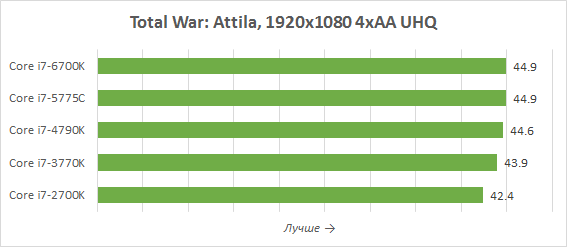
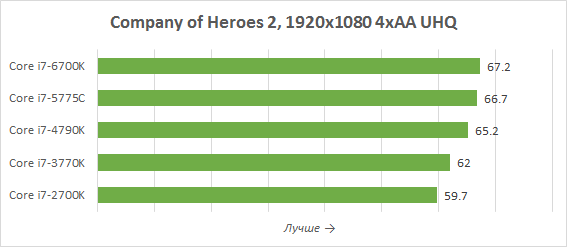
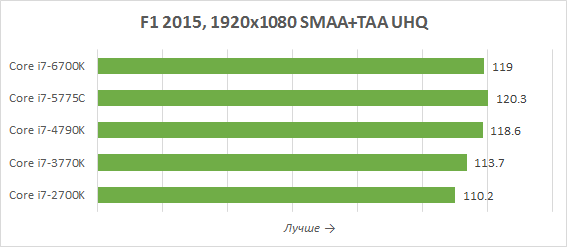
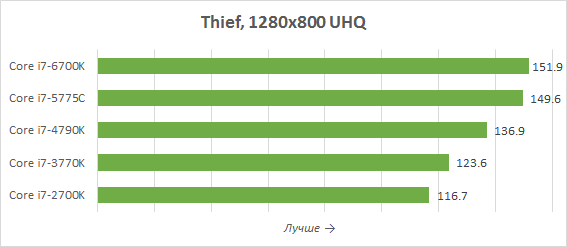
Typically, the impact of processors on gaming performance, especially when it comes to powerful representatives of the Core i7 series, is insignificant. However, when comparing five Core i7s of different generations, the results are not at all uniform. Even with graphics quality settings set to maximum, the Core i7-6700K and Core i7-5775C graphics offer the highest gaming performance, while the older Core i7 lags behind them. Thus, the frame rate obtained in a system with a Core i7-6700K exceeds the performance of a system based on a Core i7-4770K by an unnoticeable one percent, but the Core i7-2700K and Core i7-3770K processors already seem to be a noticeably worse basis for a gaming system. Switching from a Core i7-2700K or Core i7-3770K to the latest Core i7-6700K gives an increase in fps of 5-7 percent, which can have a quite noticeable impact on the quality of the gameplay.
You can see all this much more clearly if you look at the gaming performance of processors at a reduced image quality, when the frame rate does not depend on the power of the graphics subsystem.
Results at reduced resolution
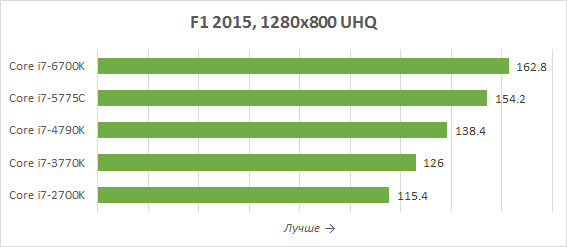
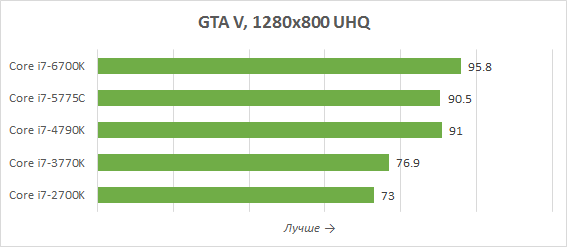
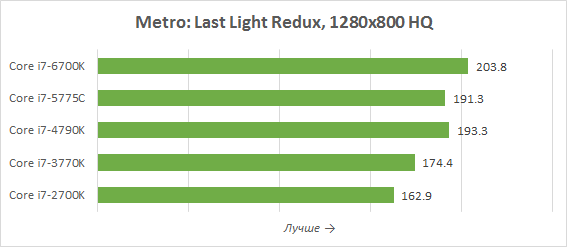
The latest Core i7-6700K processor once again manages to show the highest performance among all Core i7s of the latest generations. Its superiority over the Core i7-5775C is about 5 percent, and over the Core i7-4690K – about 10 percent. There is nothing strange about this: games are quite sensitive to the speed of the memory subsystem, and it is in this area that serious improvements have been made in Skylake. But the superiority of the Core i7-6700K over the Core i7-2700K and Core i7-3770K is much more noticeable. The older Sandy Bridge lags behind the new product by 30-35 percent, and Ivy Bridge loses to it by about 20-30 percent. In other words, no matter how much Intel is criticized for improving its own processors too slowly, the company has been able to increase the speed of its CPUs by a third over the past five years, and this is a very tangible result.
Testing in real games is completed by the results of the popular synthetic benchmark Futuremark 3DMark.
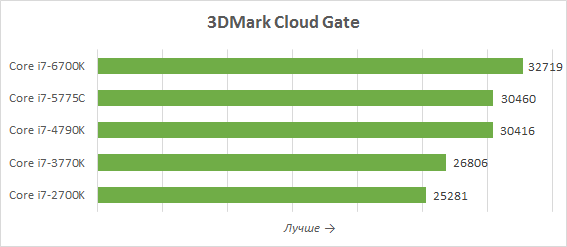
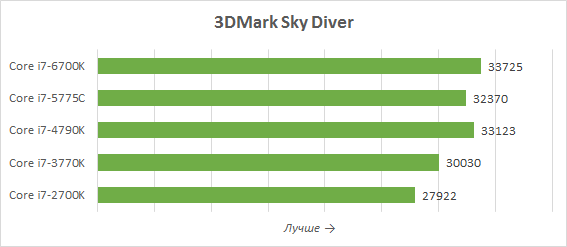
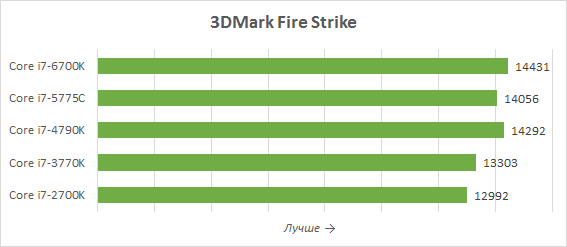
The results produced by Futuremark 3DMark echo the gaming indicators. When the microarchitecture of Core i7 processors was transferred from Sandy Bridge to Ivy Bridge, 3DMark scores increased by 2 to 7 percent. The introduction of the Haswell design and the release of Devil’s Canyon processors added an additional 7-14 percent to the performance of older Core i7s. However, then the appearance of the Core i7-5775C, which has a relatively low clock frequency, somewhat rolled back the performance. And the newest Core i7-6700K, in fact, had to take the rap for two generations of microarchitecture at once. The increase in the final 3DMark rating for the new Skylake family processor compared to the Core i7-4790K was up to 7 percent. And in fact, this is not so much: after all, Haswell processors have been able to bring the most noticeable improvement in performance over the past five years. The latest generations of desktop processors are indeed somewhat disappointing.
Tests in applications
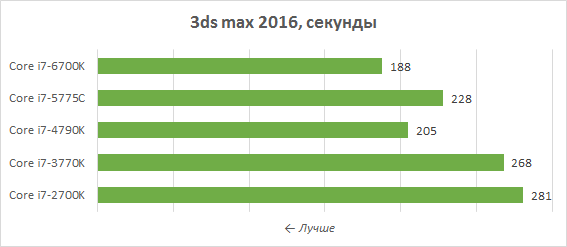
In Autodesk 3ds max 2016 we test the final rendering speed. Measures the time it takes to render at 1920x1080 resolution using the renderer mental ray one frame of a standard Hummer scene.
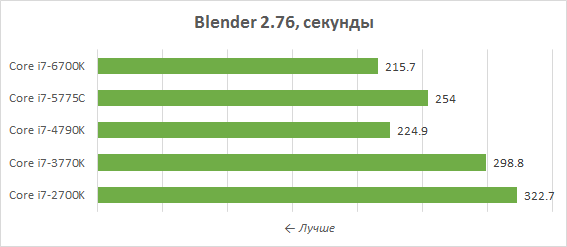
Another test of the final rendering is carried out by us using a popular free rendering package 3D graphics Blender 2.75a. In it we measure the time it takes to build the final model from Blender Cycles Benchmark rev4.
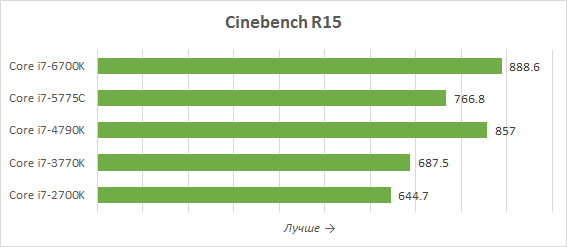
To measure the speed of photorealistic 3D rendering, we used the Cinebench R15 test. Maxon recently updated its benchmark, and now it again allows you to evaluate the speed of various platforms when rendering in current versions of the Cinema 4D animation package.
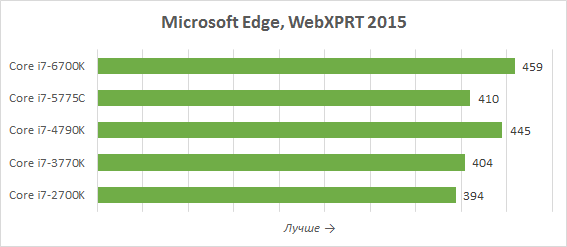
We measure the performance of websites and Internet applications built using modern technologies in the new browser Microsoft Edge 20.10240.16384.0. For this purpose, a specialized test, WebXPRT 2015, is used, which implements algorithms actually used in Internet applications in HTML5 and JavaScript.
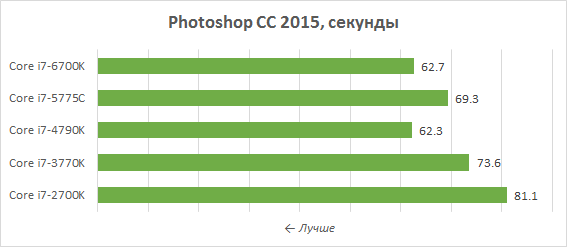
Processing Performance Testing graphic images takes place in Adobe Photoshop CC 2015. Measures the average execution time of a test script that is a creative reworking of the Retouch Artists Photoshop Speed Test, which involves typical processing of four 24-megapixel images taken with a digital camera.
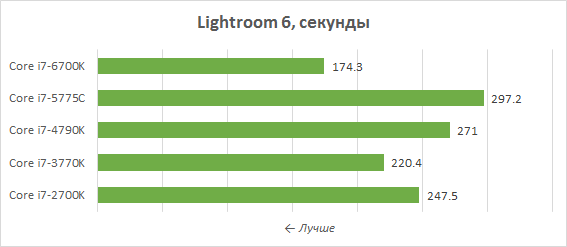
Due to numerous requests from amateur photographers, we tested graphics performance Adobe program Photoshop Lightroom 6.1. The test scenario includes post-processing and export to JPEG with a resolution of 1920x1080 and maximum quality two hundred 12-megapixel RAW images taken with a Nikon D300 digital camera.
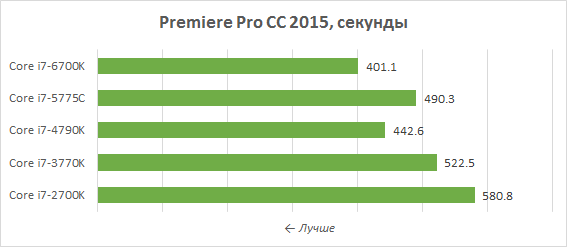
Adobe Premiere Pro CC 2015 tests performance for non-linear video editing. The time for rendering a Blu-Ray project containing HDV 1080p25 video with various effects applied is measured.
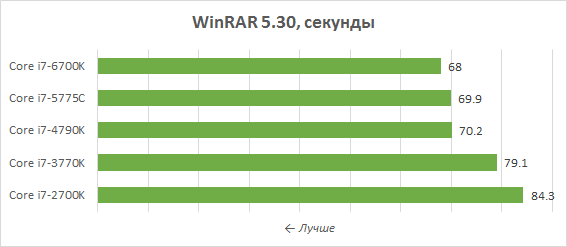
To measure the speed of processors when compressing information, we use the WinRAR 5.3 archiver, with which we archive a folder with various files with a total volume of 1.7 GB with the maximum compression ratio.
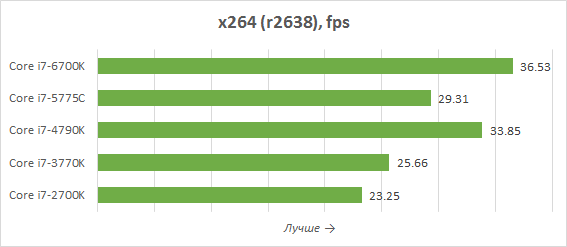
To evaluate the speed of video transcoding into the H.264 format, the x264 FHD Benchmark 1.0.1 (64bit) test is used, based on measuring the time the x264 encoder encodes the source video into MPEG-4/AVC format with a resolution of 1920x1080@50fps and default settings. It should be noted that the results of this benchmark are of great practical importance, since the x264 encoder underlies numerous popular transcoding utilities, for example, HandBrake, MeGUI, VirtualDub, etc. We periodically update the encoder used for performance measurements, and this testing involved version r2538, which supports all modern instruction sets, including AVX2.
In addition, we have added to the list of test applications a new x265 encoder designed for transcoding video into the promising H.265/HEVC format, which is a logical continuation of H.264 and is characterized by more efficient compression algorithms. To evaluate performance, a source 1080p@50FPS Y4M video file is used, which is transcoded into H.265 format with a medium profile. The release of the encoder version 1.7 took part in this testing.
![]()
The advantage of the Core i7-6700K over its earlier predecessors in various applications is beyond doubt. However, two types of problems have benefited most from the evolution that has occurred. Firstly, related to the processing of multimedia content, be it video or images. Secondly, the final rendering in 3D modeling and design packages. In general, in such cases, the Core i7-6700K outperforms the Core i7-2700K by at least 40-50 percent. And sometimes you can see a much more impressive improvement in speed. So, when transcoding video with the x265 codec, the latest Core i7-6700K delivers exactly twice as much performance as the old Core i7-2700K.
If we talk about the increase in the speed of performing resource-intensive tasks that the Core i7-6700K can provide compared to the Core i7-4790K, then there are no such impressive illustrations of the results of the work of Intel engineers. The maximum advantage of the new product is observed in Lightroom; here Skylake turned out to be one and a half times better. But this is rather an exception to the rule. In most multimedia tasks, the Core i7-6700K offers only a 10 percent improvement in performance compared to the Core i7-4790K. And under loads of a different nature, the difference in performance is even smaller or absent altogether.
Separately, I need to say a few words about the result shown by the Core i7-5775C. Due to its low clock speed, this processor is slower than the Core i7-4790K and Core i7-6700K. But do not forget that its key characteristic is efficiency. And it is quite capable of becoming one of the best options in terms of specific performance per watt of electricity expended. We can easily verify this in the next section.
Energy consumption
Skylake processors are manufactured on modern 14nm technological process with second-generation three-dimensional transistors, however, despite this, their thermal package increased to 91 W. In other words, the new CPUs are not only “hotter” than the 65-watt Broadwell, but also exceed the calculated heat dissipation of Haswell, produced using 22-nm technology and coexisting within the 88-watt thermal package. The reason, obviously, is that the Skylake architecture was initially optimized not for high frequencies, but for energy efficiency and the ability to be used in mobile devices. Therefore, in order for desktop Skylake to receive acceptable clock frequencies lying in the vicinity of the 4-GHz mark, it was necessary to raise the supply voltage, which inevitably affected power consumption and heat dissipation.
However, Broadwell processors also did not have low operating voltages, so there is hope that the Skylake 91-watt thermal package was obtained due to some formal circumstances and, in fact, they will turn out to be no more voracious than their predecessors. Let's check!
The new Corsair RM850i digital power supply we use in our test system allows us to monitor the consumed and output electrical power, which is what we use for measurements. The following graph shows the total system consumption (without monitor), measured “after” the power supply and representing the sum of the power consumption of all components involved in the system. The efficiency of the power supply itself is not taken into account in this case. To correctly assess energy consumption, we have activated turbo mode and all available energy-saving technologies.
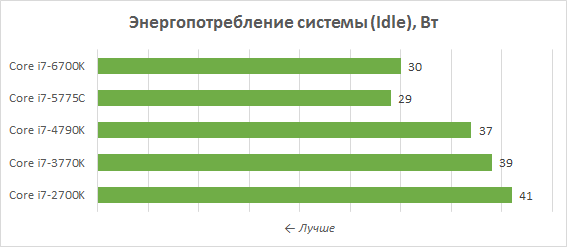
At idle, a quantum leap in the efficiency of desktop platforms occurred with the release of Broadwell. The Core i7-5775C and Core i7-6700K feature noticeably lower idle consumption.
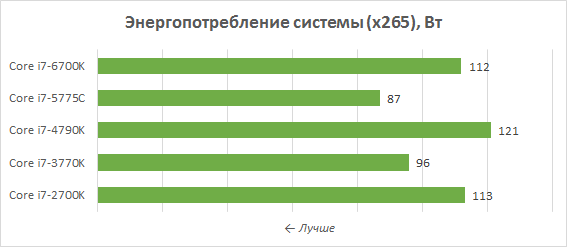
But under the load of video transcoding, the most economical CPU options are the Core i7-5775C and Core i7-3770K. The latest Core i7-6700K consumes more. His energy appetite is at the level of the older Sandy Bridge. True, the new product, unlike Sandy Bridge, has support for AVX2 instructions, which require quite significant energy costs.
The following diagram shows the maximum consumption under load created by the 64-bit version of the LinX 0.6.5 utility with support for the AVX2 instruction set, which is based on the Linpack package, which is distinguished by its exorbitant energy appetites.
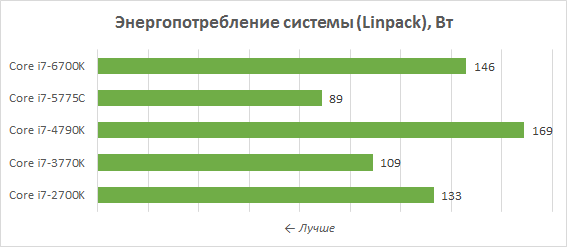
Once again, the Broadwell generation processor shows miracles of energy efficiency. However, if you look at how much power the Core i7-6700K consumes, it becomes clear that progress in microarchitectures has bypassed the energy efficiency of desktop CPUs. Yes, in the mobile segment, with the release of Skylake, new offerings have emerged with extremely tempting performance-to-power ratios, but the latest desktop processors continue to consume about the same amount as their predecessors consumed five years before today.
Having tested the latest Core i7-6700K and compared it with several generations of previous CPUs, we again come to the disappointing conclusion that Intel continues to follow its unspoken principles and is not too keen on increasing the performance of desktop processors aimed at high-performance systems. And if, compared to the older Broadwell, the new product offers approximately a 15% improvement in performance due to significantly better clock frequencies, then in comparison with the older, but faster Haswell, it no longer seems as progressive. The difference in performance between the Core i7-6700K and Core i7-4790K, despite the fact that these processors are separated by two generations of microarchitecture, does not exceed 5-10 percent. And this is very little for the older desktop Skylake to be unambiguously recommended for updating existing LGA 1150 systems.
However, it would take a long time to get used to such minor steps by Intel in increasing the speed of processors for desktop systems. The increase in performance of new solutions, which lies approximately within these limits, is a long-established tradition. There have been no revolutionary changes in the computing performance of Intel CPUs aimed at desktop PCs for a very long time. And the reasons for this are quite clear: the company’s engineers are busy optimizing the microarchitectures being developed for mobile applications and, first of all, think about energy efficiency. Intel's success in adapting its own architectures for use in thin and light devices is undeniable, but adherents of classic desktops can only be content with small increases in performance, which, fortunately, have not yet completely disappeared.
However, this does not mean that the Core i7-6700K can only be recommended for new systems. Owners of configurations based on the LGA 1155 platform with processors of the Sandy Bridge and Ivy Bridge generations may well be thinking about upgrading their computers. Compared to Core i7-2700K and Core i7-3770K new Core The i7-6700K looks very good - its weighted average superiority over such predecessors is estimated at 30-40 percent. In addition, processors with the Skylake microarchitecture can boast support for the AVX2 instruction set, which has now found widespread use in multimedia applications, and thanks to this, in some cases the Core i7-6700K turns out to be much faster. So, when transcoding video, we even saw cases where the Core i7-6700K was more than twice as fast as the Core i7-2700K!
Skylake processors also have a number of other advantages associated with the introduction of the new LGA 1151 platform accompanying them. And the point is not so much in the support for DDR4 memory that appeared in it, but in the fact that the new logic sets of the hundredth series finally received really high-speed connection to the processor and support for a large number of PCI Express 3.0 lanes. As a result, advanced LGA 1151 systems can boast of numerous fast interfaces for connecting drives and external devices, which are devoid of any artificial bandwidth limitations.
Plus, when assessing the prospects of the LGA 1151 platform and Skylake processors, you need to keep one more thing in mind. Intel will not rush to bring the next generation of processors, known as Kaby Lake, to market. According to available information, representatives of this series of processors in versions for desktop computers will appear on the market only in 2017. So Skylake will be with us for a long time, and the system built on it will be able to remain relevant for a very long period of time.