Technologies do not stand still. Every month, or even every day, we are presented with new products in one area or another. Computer techologies is now in one of the first places, because nowadays everyone has a laptop, desktop PC, tablet, smartphone or any other achievement of the IT progress of mankind. With the introduction of innovations, technology also improves.
In the recent past, 7-8 years ago, computers with 2 GB of RAM were considered super-powerful. Now even 16 GB is not the limit. Processors operate at ever higher clock speeds, the number of cores in them is increasing, and there are processor designs with 24 cores! Video cards display such real images in games that it is sometimes unclear whether this is a game or a recording from a video camera. The future has already arrived.
Software and modern games try to keep up with the times, so they release products for the latest hardware. Such equipment requires control and careful care. Often, powerful processors and video cards overheat during operation. To prevent this, there is special programs, monitoring the temperature of all system elements in real time.
Often, powerful processors and video cards overheat during operation.
What programs exist for monitoring temperature sensors? Where can I download them and how to use them? What temperature is normal and what temperature signals severe overheating? And what should you do if the processor and video card start to heat up? This is discussed in our article.
Temperature tracking programs
There are many programs that show the operating temperature of the main PC components. In this review we will look at free programs, which do not require registration and are not too demanding on the system. It is worth noting that these utilities are suitable for both desktop computers, and for laptops running operating Windows systems 7, 8 and 10.
TechPowerUp GPU-Z program
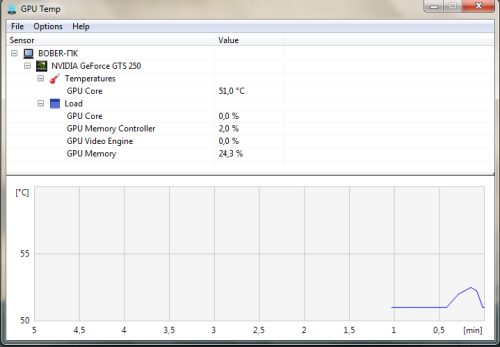
An additional feature is monitoring the heating and cooling of the video card under load. To do this, you need to minimize the program to tray, check the box Options - Minimize to tray. Next you need to launch the game or powerful graphics programs, like Adobe Photoshop or Lightroom. After finishing work, going to GPU Temp, you can see how the temperature changed during work. Record the temperature minimum and maximum.
● Posted by: Denker ● Mar 23, 2014 ●
Is your processor temperature normal or “don’t understand mine?” CPU temperature monitoring Intel / AMD - monitoring the temperature of the AMD / Intel processor. Find out about useful programs for CPU, download programs for measuring processor temperatures...
It is no secret that computer components, and in particular processors and video cards, generate a large amount of heat, which must be removed to ensure optimal operation. Normal processor temperature (cpu temperature) is an important factor affecting the life cycle and stable operation of processors. An uncontrolled increase in operating temperature conditions means, at a minimum, system instability, crashes, errors, freezes, incomprehensible reboots, and, as a consequence, the expected maximum - the premature death of the processor.
How to find out the real processor temperature, pitfalls of monitoring processors. Or a true and normal cpu temperature is needed not only by an overclocker. What is the operating temperature of the processor program free download....
Optimal processor temperatures. CPU temperature monitoring - how to measure the processor temperature and whether it is necessary to do it.
Download CPU Thermometer – the second most functional processor temperature control program, a greatly reduced version of the utility Open Hardware Monitor. The CPU Thermometer's capabilities are limited to displaying the temperature and load of processor cores in the system tray. It is possible to change the color of the cpu temperature monitoring indication. You need the current processor temperature in the tray, download free CPU Thermometer – Download CPU Thermometer .
Download Real Temp 3.60 – 3.70
– highly specialized processor temperature program Intel Core, Core i7, Quad Core, Dual Core. Allows you to accurately measure the temperature of the processor, as it is able to take data directly from the sensors of the processor cores. Real Temp 3.60 can also test sensors, create a load to warm up the Intel CPU, test performance, and change TjMax values (critical processor temperature) for each core. Real Temp has a warning function when threshold cpu temperature is reached and a function emergency shutdown PC. To start monitoring CPU temperature you need to download Real Temp 3.60 for free - Download Real Temp 3.60 .
Updated RealTemp 3.70 CPU temperature monitor - Download Real Temp 3.70 .
Download Core Temp 0.99.8 - 1.00.6
– accurate processor temperature program for monitoring AMD and Intel processors (from obsolete to the latest). Real-time CPU temperature monitoring uses core sensors to ensure accuracy. Core Temp 1.0 is compact, undemanding of resources, can display load, frequency, processor temperature in the tray, and is equipped with a warning function. Has a number useful additions, including Core Temp Gadget 2.6 and the Windows Media Center plugin. And it simply helped out many times when monitoring machines were unable to find out the processor temperature and were talking all sorts of nonsense. CPU temperature program free download Core Temp 0.99.8 – Download Core Temp 0.99.8 .
CPU temperature monitoring free download Core Temp 1.00.5 - Download Core Temp 1.00.5 .
We update, monitor the processor temperature with Core Temp 1.00.6 Download Core Temp 1.00.6 .
Download SpeedFan 4.44-4.45-4.49 rus
– if you want to find out what processor temperature the Speed Fan program will help you with this, and besides, its capabilities are not limited to this. The responsibilities of SpeedFan rus 4.44 include temperature control, voltage monitoring, CPU frequency, fan speed, hard drive temperature, SMART data with selected sensors displayed in the tray. Speed Fan also keeps statistics, saves data to a log file, and draws graphs of speed, voltage, and temperatures. SpeedFan 4.43 - 4.49 works under Windows Vista and Windows 7, XP, NT, ME, 2000, 2003, 9x.
Normal CPU temperature free download SpeedFan RUS 4.44 – Download SpeedFan 4.44 rus .
CPU temperature program free download SpeedFan RUS 4.45 — SpeedFan 4.45 rus Download .
Find out the processor temperature program download SpeedFan RUS 4.46 - SpeedFan 4.46 rus Download .
Download and update SpeedFan program 4.49 RUS for new processors - SpeedFan 4.49 rus Download .
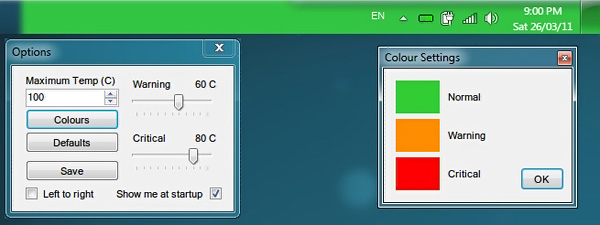
Download Hmonitor 4.5.3.2 - 4.5.3.7
- a program for monitoring processor temperature, hard drive, voltage and fan speed. CPU temperature monitoring Hmonitor supports all Windows versions. It has a Sidebar Gadget with sound signals, extensive customization options, and a choice of different action scenarios when the CPU overheats. 4.5.2.7 Hmonitor is a normal CPU temperature, monitoring and response to extreme situations in automatic mode.
Find out how to measure CPU temperature for free download Hmonitor 4.5.3.2 – Download Hmonitor 4.5.3.2 .
Accurate CPU temperature program free download Hmonitor 4.5.3.7 – Download Hmonitor 4.5.3.7 .
Download Open Hardware Monitor
– CPU temperature monitoring, load and voltage sensor monitoring, clock frequency, fan rotation speed. Open Hardware Monitor supports almost all motherboards for AMD platforms and Intel. The utility can also read SMART readings hard drives and video card sensors. Open Hardware Monitor can display any data as a gadget or tray icon. Supports Linux and all versions of Windows. The CPU temperature program is distributed free of charge, download Open Hardware Monitor – Download Open Hardware Monitor v0.4.0 .
Updated version of the program - Open Hardware Monitor v0.5.1 Download .
The next program update - Open Hardware Monitor v0.6.0 Download .
Download PC-Wizard 2010 - 2012
– a versatile program for monitoring processor temperature and diagnosing computer components. The capabilities of PC-Wizard are multifaceted, including analysis of PC configuration, testing of components, monitoring and evaluation of processor performance, checking HDD speed, testing random access memory and many others When minimizing the PC-Wizard 2010 program, it is possible to display system parameters on top of all windows in the form of a compact display. Whether you are playing or working, you will always be able to see the system’s reaction to certain loads.
CPU temperature monitoring free download PC-Wizard 2010-1.961 – Download PC-Wizard 1.961 .
CPU temperature monitoring download PC-Wizard Portable for free – Download Portable PC-Wizard 2010-1.961 .
Checking CPU temperature download PC-Wizard 2012_2.0 free – Download PC-Wizard-2012-2.0 .
In 2013, we check the temperature of the processors using PC Wizard 2013-2.12 – Download PC-Wizard-2013-2.12 .
Official version CPU-Z-1.67.1 + Portable + versions G1, OC, ROG whoever likes it - Download CPU-Z 1.67.1 .
Whether you like it or not, the normal processor temperature is in your hands - don’t miss it. You need to know the enemy by sight; the program you choose for processor temperature will help you with this.
For those who are not sure of their choice or want to try all the “medicines”, I suggest downloading the file - cpu temperature monitoring. There you will find all the programs mentioned above for monitoring CPU temperature. And also, since you’ve decided to find out the processor temperature, it’s a good idea to find out what bit depth your processor supports - don’t hold back the capabilities of your PC’s 32-bit OS - Download 32-64bit Checker 1.1 .
And we kindly request - before asking questions about hardware, get comprehensive and accurate information about the hardware of your computer - information about PC components for 32bit-64bit OS - Download HWiNFO32-64 .
The normal temperature of the processor is entirely in your hands; take care of the hardware, and it will repay you with many years of service. Here you can download all voiced monitoring programs in one file –
CPU Temperature Monitoring 2014– 28.6Mb.
CPU Temperature Monitoring 2015– 18.55Mb.
Best wishes
Denker.

Comments 28
Alexander: 01/14/2014 at 15:08
My CPU temperature is now normal.
Thanks to the author for raising the topic and selection good programs to monitor CPU temperature. I bought a computer in the fall, and everything seemed to be going haywire with the temperatures and operation of the PC, until the heating was turned on (the table was near the window, and there was a battery there) - the computer began to freeze and shut down when playing games. I downloaded Core Temp, SpeedFan rus and HWiNFO (I liked the HWiNFOMonitor gadget), all three unanimously said - your processor temperature is not normal and the voltage is too high, so it’s freaking out. I corrected this issue in the motherboard, climbed into the “black box”, checked the fastening of the cooler, but they screwed it on in the store badly. I took it off, wiped it, spread the paste, screwed it on - minus 20 degrees, normal flight. I left the programs, now I will monitor the processor temperature periodically, and it will come in handy in the summer. Denker, thank you very much!Petrovich: 01/16/2014 at 12:42
It is preferable to measure the processor temperature before rather than after.
The CPU temperature program is necessary and very useful and should be installed on every computer. From time to time I help my friends and acquaintances assemble computers. By the way, for the last two years I have been using only your recommendations, Denker - everyone is happy. Special thanks to you for this invaluable and free information. Returning to the CPU temperature - for me personally, knowing the processor temperature is a primary task. Firstly, you check yourself so that you don’t mess up anywhere. Secondly, you check the motherboard and the cooler itself - to be sure that there is a safety margin in terms of temperatures, so that when the weather warms up the owner will not be shocked. So ladies and gentlemen, don’t be lazy to download the programs, your AMD or Intel processor temperature should be under control - for your own good. I think no one will deny that it is better to find out the processor temperature before problems begin, because they can be irreversible.
Denker: 01/18/2010 at 19:19
AMD processor temperature is high.
First check the CPU voltage, motherboard could have overestimated it, which most likely caused excess heating. This is not an isolated case and this needs to be checked first. Now, regarding processor temperatures, the critical temperature for the Athlon II 630 is 71? C, you are close. The normal temperature of the processor at rest is 35-37°C, when warming up 55-58°C (box cooler). Allowable safe voltage values are 0.9 – 1.425V, set to 1.375V, run Core Temp 0.99. the temperature difference must be significant.MaxSU: 04/05/2010 at 20:53
Working temperature amd processor.
A similar situation, only I have a working temperature AMD Athlon 635 and the average CPU temperature was 68°C at Core Temp 0.99. I took Denkera’s advice, the medicine worked - the temperature of the amd 635 processor is normal, up to 58 degrees. Thanks Den!Vym.Per. : 11.25.2012 at 19:47
A smart site, smartly made, and the style of presenting information is absolutely superb. Being a complete lamer (or, as they also say, a spacer between the keyboard and the chair) in all this “hardware”, only here, finally, I not only found what I was looking for, but also generally understood what I was looking for. Usually the creators of such sites are complete brains, writing for the same brains, and not for ordinary people, but here the author has not only brains, but also a sense of humor in complete order.
In short, everything works great, and this SpeedFan (what a word, it’s like an AIDS fan), and Cor, and Monitor, all work great. The temperature shown by all three is almost identical, which means they don’t lie and are quite acceptable to use (IntelCor especially, it’s tiny and keeps the current number at the bottom left, which is very convenient).
Actually, there are no questions, the above programs showed that my old laptop (bought secondhand and I’ve had for more than 3 years) is still very good, everything is within reason, and there are no traces of overheating (which, in principle, is not surprising, the fan and radiator are clean I contain). I just wrote because the site is good and everything here is great and done wisely. Thank you.
Denker: 05/24/2012 at 15:22
CPU temperature program download for free.
In the board's specifications, the Core i3-2120 processor is among the supported ones. To begin with, how to measure the processor temperature, with what program - I recommend downloading Core Temp, SpeedFan rus or downloading Real Temp, better than a couple of three to be sure of the accuracy of the result. Programs for monitoring processor temperature, like people, can sometimes make mistakes. For processors, it is advisable to check the Core Voltage parameter - if you set something manually, for the i3-2120 it can take a value from 1.0xxV (for example, 1.096V - 1.128V), it is not advisable to exceed 1.38V. The same SpeedFan rus will show whether the processor temperature is normal and Voltage or not; to check Core Voltage, you can also use the CPU-Z program. If you haven't kicked the computer, it might have been secured poorly. CPU cooler and what made him skewed was that most likely the motherboard raised the Voltage, and with it the processor temperature increased. The critical temperature for the Core i3-2120 processor is 69°C. Don’t forget that it’s summer and the room could get warmer; in any case, programs for monitoring processor temperature will help you.Victor: 03/25/2013 at 15:03
This is exactly what the doctor ordered for processors. Even best program to check the CPU temperature may be wrong. Somewhere when updating the program, an inaccuracy or error was made, and what you see before your eyes is not the real temperature of the processor. This is similar to buying a thermometer at a pharmacy; in order to find out the real temperature and determine which one is lying, you need to take several and measure it on yourself. With the processor the same parsley, to eliminate the error, we select three programs to check the temperature of the processor, leave those in which the data matches, the inadequate program will be corrected in the next update, but during this time the processor may burn out. So trust the developers, but check.
There may be several reasons, from the banal - summer, a significant increase in room temperature, the radiator is clogged with dust, BIOS settings changed the fan rotation speed until the cooler shifted when moving (check carefully and lightly - it should not move in any plane).
Denker: 07/17/2009 at 18:08
Important! How to download programs for the processor.
Ladies and gentlemen, all programs for checking CPU temperature are downloaded for free. IN Lately a window began to open offering GOLD status - do not enter a phone number. In the right corner of the red frame, click on the same cross. The naughty Depositfiles window will close and access to the program you need will open. Therefore, you can find out the processor temperature absolutely free. I can’t influence the tricks of Depositfiles.
$Alexandr$ : 07/23/2009 at 18:05
The processor temperature program is required.
Thanks for the reminder about an important part of computer operation. With the arrival of summer, inadequate PC performance was noticed. I took the advice to download cpu temperature monitoring, the check confirmed your words and my fears. The temperature program was selected SpeedFan processor rus, CPU monitoring showed a temperature close to critical, and this is without overclocking and frying with programs and the voltage is too high. I corrected the voltage, lost about 15 degrees, now my processor temperature is normal, the PC does not glitch or freeze, thanks again for the article, and for the cpu temperature monitoring, of course. Good luck!
German35: 09/17/2009 at 17:32
I thought I knew how to measure the processor temperature, BUT.
Not long ago I bought myself new computer and out of habit I decided to measure the processor temperature. I decided to measure the processor temperature in Everest and was terribly surprised by the cpu temperature after startup - 80? C, then the operating temperature of the processor up to 100? C. Whoever said it would not believe it. I downloaded SpeedFan, I don’t remember exactly which one, the CPU temperature is below room temperature - nonsense. I decided to download Core Temp and lo and behold, I saw real numbers. As I learned later, the processor temperature program SpeedFan and Everest tried to find out the processor temperature, take data from a non-existent sensor (they got confused), and Core Temp coped with this task, since it worked without intermediaries and used data from sensors installed in the CPU. So if you are planning to monitor the processor temperature, download a couple of programs, your favorite and a control one, so as not to guess whether the operating temperature of the processor is normal or bullshit. +10 to the author.
MaxPerlov: 08.11.2009 at 20:17
A good processor temperature program download Core Temp.
I encountered the same situation, purchased Everest, decided to play around with monitoring and was scared by the CPU temperature. Thanks to the author for enlightening me, I downloaded Core Temp - the normal processor temperature is pleasing to the eye. And somehow the cpu temperature from Everest at 80 degrees looked very scary. Now I'm learning PC-Wizard - a powerful program.
NahimovS: 12/14/2009 at 21:14
CPU temperature measurement.
I wanted to ask why my SpeedFan shows crazy CPU temperatures. I read it - I understood the hint, thanks to the author for the topic. I'll try to find out the processor temperature using another program, I'll try Real Temp and the vaunted Core Temp, I'll report back. For those who doubt the need to control the CPU temperature, I will say this - the processor temperature program is a necessary thing, no, rather necessary, I tested it through bitter personal experience. My relatively new processor was diagnosed with overheating. So first it is better to monitor the processor temperature, and then everything else, on the contrary, it is not economically profitable - I checked.
AntonRF: 01/15/2010 at 22:05
Critical temperature Athlon processor x4 630.
I have a question - what is the normal temperature for the Athlon 630 processor, and what is the critical temperature? Mine warms up to 69°C during video encoding, this is normal and how critical. Temperature program used Core processor Temp 0.99. Or advise which program to download and how to measure the processor temperature?
Fanspeed: 06/09/2010 at 21:08
I recommend downloading the CPU temperature program SpeedFan 4.45 rus.
I want to roll back the barrel of SpeedFan a little. I agree there were errors; it was not always possible to find out the temperature of the processor when new motherboards and sensors appear - this is inevitable and the CPU Speed Fan is no exception. But, as a rule, such problems are quickly corrected. I advise you to download SpeedFan 4.44 rus for free - a super program. PC-Wizard is a good processor, and I give credit to Core Temp 0.99.8, although I prefer to use rus SpeedFan 4.44. The processor temperature program Core Temp and SpeedFan have been updated, I recommend downloading Core Temp 1.0 RC2, and also downloading SpeedFan 4.45 rus.
Alexander: 05/24/2012 at 15:20
How to find out the processor temperature.
I built a computer with a core i3 2120 and an ECS H67-h2-a3 board, but on the motherboard website the model of this processor is not in the list of supported ones, and after updating the BIOS the processor temperature increased, can you tell me how I can fix it and find out how undesirable this is?
One of the factors affecting the speed of a computer/laptop is the temperature of the processor, video card and other components. The higher the temperature, the slower the computer/laptop will work. If the processor or video card is overheated, it may fail, and long-term operation in high heat mode reduces its service life. At critical temperatures, the device will turn off spontaneously (overheating protection is triggered). To prevent overheating of the processor, video card and other components of the computer/laptop, it is necessary to periodically monitor the temperature and, if it reaches critical values, take measures to reduce it. How and with what to check the temperatures of the processor and video card and how to reduce the temperature will be described in this article.
There are two ways to check the temperature of the processor, video card and other computer/laptop components:
1 View the temperature in the BIOS;
2 Use third-party programs.
Find out the temperature of the processor and other components in the BIOS.
In order to get into the BIOS when booting a computer or laptop, press the F2 or Del key (the buttons may differ, depending on the motherboard model). Then in the settings you need to find the Power/ Monitor menu in different versions BIOS will be different. There you will see the temperature of the processor, motherboard, etc.
Let me give you an example of how I looked at the temperature on the motherboard ASUS board in UEFI (Unified Extensible Firmware Interface - a replacement for the obsolete BIOS, used in modern motherboards). Once you are in UEFI, click the "Advanced" button.
After that, go to the “Monitor” tab, you will see the temperature of the processor, motherboard and much more information.

Thus, without installing any programs, you can find out the temperatures of computer/laptop components. The disadvantage of this method is that not all motherboards have this option and it is impossible to view the processor temperature under load (when running “heavy” programs or games).
Find out the temperature of the processor and video card using programs.
There are a large number of different programs that will show you online the temperatures of computer/laptop components. In this article I will analyze several such applications and give my assessment of their work.
Find out the temperature of computer/laptop components using the AIDA64 program.
AIDA64 is one of the most popular programs for reviewing and diagnosing a computer/laptop. AIDA64 provides comprehensive information about the composition of the computer: hardware, programs, operating system, network and connected devices, and also shows the temperature of all computer/laptop devices.
Program window showing temperature data from sensors.
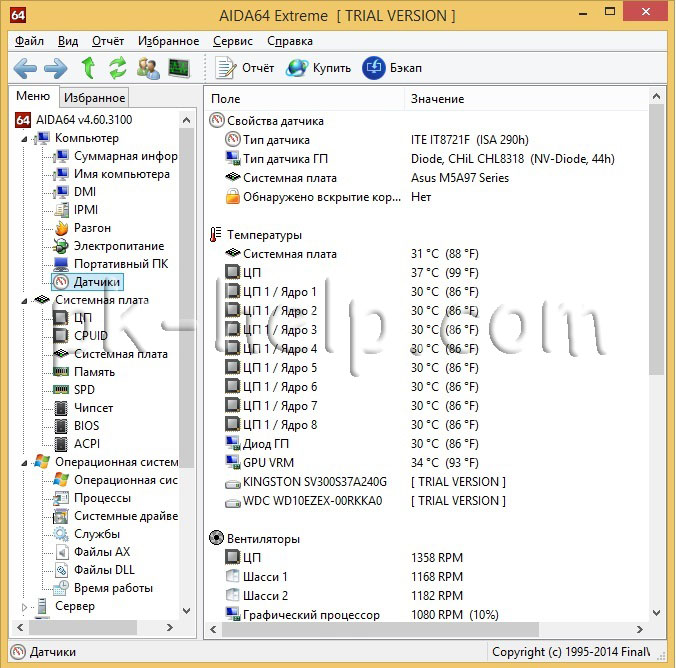
It should be said that the program is paid and the trial version (30 days) does not show information about all devices - in my opinion this is the main disadvantage of this program.
Find out the temperature of the processor and video card using the Speccy program.
Speccy is a small utility from the developers of the most popular application for cleaning your computer from system garbage CCleaner. When launched, Speccy monitors the computer's hardware and displays information about operating system, characteristics of installed hardware and data from sensors.
Below the program interface.
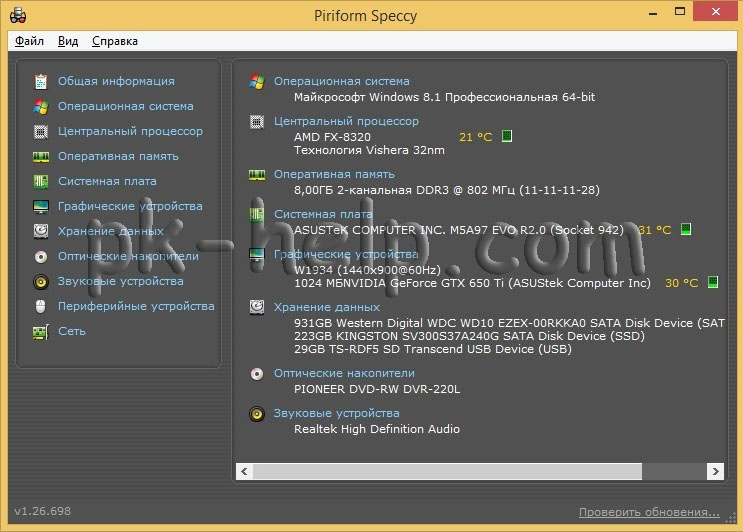
In my opinion, it is one of the best programs for determining the temperature of the processor, video card, etc. In addition to information from sensors, it also provides a detailed analysis of all the hardware installed on the computer/laptop. The big advantage is that the program is free.
Find out the temperature of the processor and video card using the CPUID HWMonitor program.
CPUID HWMonitor - a program designed to monitor the performance of various computer/laptop components (temperature, fan speed, and voltage).
Below is the interface of this program.
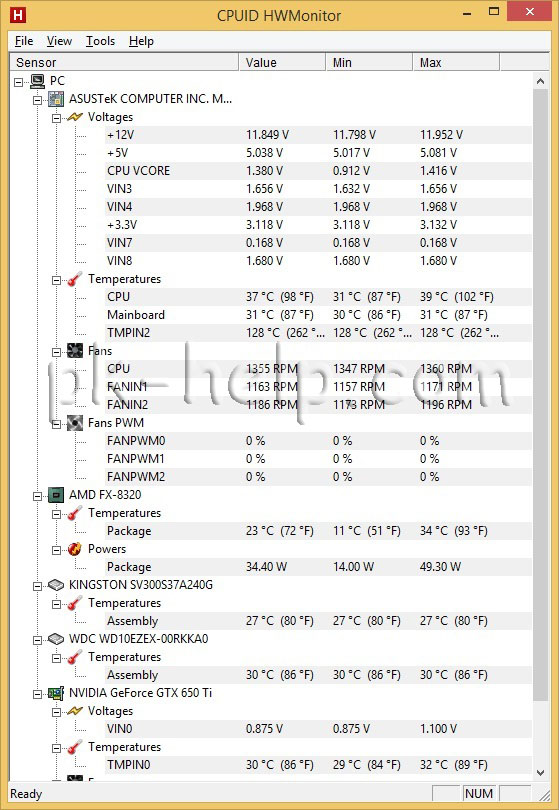
In my opinion, the ideal solution for those who are only interested in information about the temperature of all PC components. No unnecessary information, just temperature and fan speed, plus minimum and maximum values are shown, in addition, this program is absolutely free.
What should be the temperature of the processor and video card.
Different processor manufacturers set their own temperatures, but generally speaking, the temperature should be between 30-45°C at idle, up to 60-65°C under load, anything higher is considered critical. Let me explain that these are average values; more specific information should be found on the website of your processor manufacturer.
For a video card, the normal temperature is up to 50-55°C at idle, and under load up to 75-80°C. You can find more accurate average values on the website of your video card manufacturer.
What to do if the temperature of the processor or video card is high.
1 Clean your computer/laptop from dust. Make sure all coolers and vents are free of dust. This is the most common problem overheating of the computer, laptop. To fix it, you need to disassemble the computer/laptop and remove all dust that interferes with cooling.
2 Replace thermal paste. Thermal paste is a layer of heat-conducting composition (usually multi-component) between the processor and the heatsink. Over time, this paste dries out and loses its properties, causing the processor and video card to overheat. To replace it, you need to disassemble the computer, remove the old thermal paste from the laptop and apply a new one in a THIN layer. Typically, thermal paste is replaced when cleaning the computer/laptop from dust.
3 Replace the radiatorcooler. You should choose a better quality radiator, cooler for better cooling computer. In addition, it is quite possible that you should additionally install a cooler on the case for better heat removal from the computer.
I hope I helped you determine the temperature of the processor and video card and you were able to reduce it and achieve faster and more stable operation of your computer/laptop.
29.07.2011
Hot summer weather puts your computer to the test. One of the reasons for strange errors, freezes, and reboots may be overheating of the computer. If you do not pay attention to this in time, you risk becoming a customer of the service center.
One of the “seasonal” malfunctions is computer overheating. For normal operation, computer components require a certain temperature regime. During operation, they emit a certain amount of heat, and taking into account the increased temperature in the room in summer, the temperature of the components becomes an order of magnitude higher. If you are also overclocking your computer and have insufficient cooling or have not looked into the system unit for a long time and everything there is clogged with dust, then the likelihood of your computer overheating increases.
Overheating of the computer is fraught with unstable operation of the computer as a whole, frequent reboots, freezing, and in some cases can lead to physical damage computer nodes. Therefore, it is so important to “keep your finger on the pulse” and prevent overheating. Having noticed the problem in time, you can eliminate the causes of its occurrence - clean or replace standard system cooling to a more efficient one, change the thermal paste on the processor, etc.
In this article we offer you short review most popular programs to monitor the temperature of PC components.
Core Temp
www.alcpu.com/CoreTemp
This utility is compact and does not require resources. Supports a wide range of processor models from both Intel and AMD. Displayed in the system tray; if it overheats, it displays a corresponding message. A special desktop gadget is also available for download.
SpeedFan
www.almico.com/speedfan.php
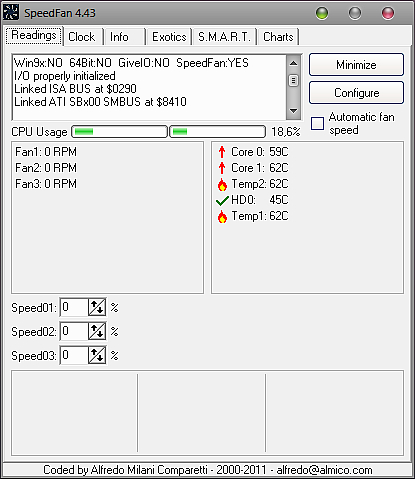
The popularity of this program is due not only to the fact that it is one of the very first programs of this type, but also to the presence of wide functionality in it. Temperature control is just one of the options available. SpeedFan reads voltage, frequency, fan speed, SMART data, hard drive temperature. Values the necessary sensors may appear in the tray. The program draws graphs, writes log files, etc.
The program is also popular for its ability to regulate fan speed to lower the processor temperature.
Real Temp
www.techpowerup.com/realtemp
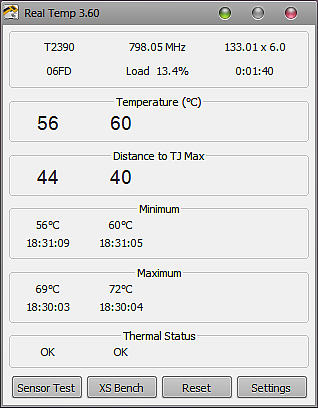
Real Temp does not require installation, but only understands Intel processors(Core, Dual Core, Quad Core and Core i7). According to the developers, the program produces the most realistic data possible, because The temperature is read directly from the sensor located in the processor core. Real Temp can turn off your computer when it overheats. You can also use it to test the temperature sensor and processor performance.
Hmonitor
www.hmonitor.net
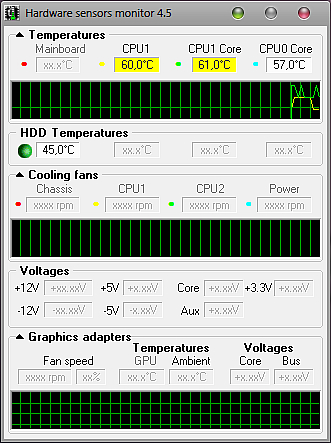
Hmonitor monitors the temperature of the processor cores, the temperature of the hard drive, voltage, and fan speed. Very convenient in terms of displaying values and actions in case of overheating ( sound signal, turning off the PC and even sending letters to the administrator).
PC-Wizard
www.cpuid.com/softwares/pc-wizard.html

This is already a whole complex, with the help of which you can not only monitor current values, but also test equipment.
Open Hardware Monitor
openhardwaremonitor.org
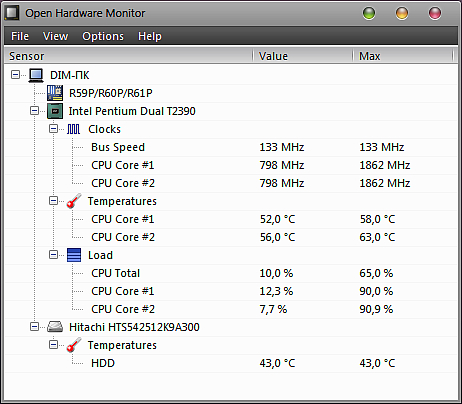
Open Hardware Monitor is available for both Windows and Linux. Is software with open source code(open source software). Displays not only standard temperature sensors, fan speed, voltage, load and processor frequency, but also SMART hard drives and video adapter sensors. Understands Intel and AMD processors.
Temp Taskbar for Windows 7
anonymous-thing.deviantart.com
Designed solely to display CPU temperature, however what is unusual is the way it does this. The temperature indicator is the Panel Windows tasks, which is painted in different colors.
Checking the temperature of the main PC components is a task that needs to be solved extremely rarely. And not everyone will benefit from such an experience. It’s another matter if the software starts to work unstable, the computer crashes or unexpectedly turns off by itself. Especially when such problems appear only in applications that use the maximum amount of machine resources. A program for the processor and video card is the first thing that will help in diagnosing such problems.
Main signs of overheating
As mentioned above, checking temperature is a fairly rare operation. Usually it is required when testing hardware without overheating. Reasons for such suspicion may be:
If one or more of the above symptoms appear, you must use a program to measure the temperature of the processor and video card. Detecting this type of problem initial stage their formation can save from many troubles in the future.
Sometimes, when an alarm signal is received, some users may advise you to remove the computer cover and try to touch each element of the machine to check whether the temperature level is within acceptable limits. Under no circumstances should you act like this!
- Firstly, you can simply get burned. It happens that under load the video card core heats up to 120. Moreover, sometimes the manufacturer indicates that values in this range are normal and will not harm the device.
- Secondly, there is a risk of injury electric shock. Someone will say: “What’s terrible there - it’s only 12 Volts.” Do not underestimate this voltage, especially since the current can reach so many amperes that you won’t want to look under the cover if it breaks for a long time.
- Third, you can damage expensive equipment. Moving a component or touching a hanging wire to an exposed area of the boards can sometimes cause a short circuit. If the power supply is protected at a high level, the computer will simply turn off. If the power supply is not the most expensive, something will burn out.
And lastly: the program will show the user exact data that can be remembered or recorded. Some applications allow you to keep logs. They will record all readings over time. This makes troubleshooting easier.
Well, now - a mini-review.
HWMonitor
A small application that can do nothing but display indicators of temperature, frequency and voltage of system elements. What is important is that it is absolutely free. There is a professional version, for which you will have to pay a little money, but the functionality of the regular one is quite enough for the average user.
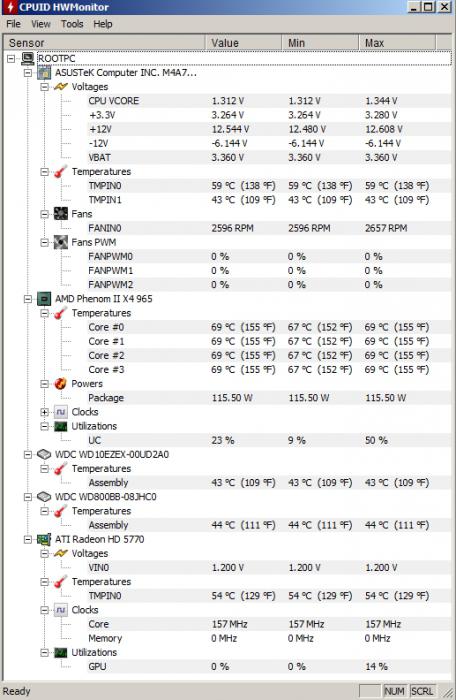
After installation and launch, the program for measuring processor temperature will display a small window with four columns:
- In the first (sensor) you can see the name of the monitoring element.
- The second (value) will indicate the current temperature value.
- In the third (min), the application saves the minimum parameter. That is, if during operation of the software a temperature range from 37 to 70 degrees was recorded, then the number 37 will be recorded in this scale.
- And in the last one (max), the application will show the maximum value observed during its operation.
SpeedFan
Another one small program for measurement - SpeedFan. Distributed absolutely free. Has the support of almost everyone modern devices, contribute to this frequent updates software developer.

Once SpeedFan is downloaded, installed and launched, its main window will open. It will contain all the main information. First, pay attention to the right side, where the device temperatures are located:
- HD0 (any other index can be used instead of zero) - hard drive.
- CPU - overall temperature of the central processor.
- CORE - CPU core temperature.
- MB - RAM.
- GPU is the core of a video card.
Monitoring the operation of cooling systems in SpeedFan
The left side of the window shows the speed of the coolers installed inside system unit. Information will be displayed only about those devices that have a built-in tachometer. This approach is very convenient. You can compare the number of revolutions per minute when the PC is idle and under load. If the CPU temperature software shows the same number in both cases, it probably needs replacing. Typically, when running resource-intensive programs, the speed of the coolers increases along with the frequency of the central processor.
MSI Afterburner
MSI Afterburner differs from the previous described products in that this program for measuring the temperature of the processor and video card is in Russian. Its main application is overclocking the graphics adapter, however, the monitoring tools in the application are also convenient.
After installation, the main window will open. The interface is made with a twist and will be unusual for the average user. But for us, the program is interesting not because of its design, but because of its information content. The right circle will show the temperature of the graphics adapter. At this time, the lower field displays many graphs that can be scrolled through using the regular scroll bar.
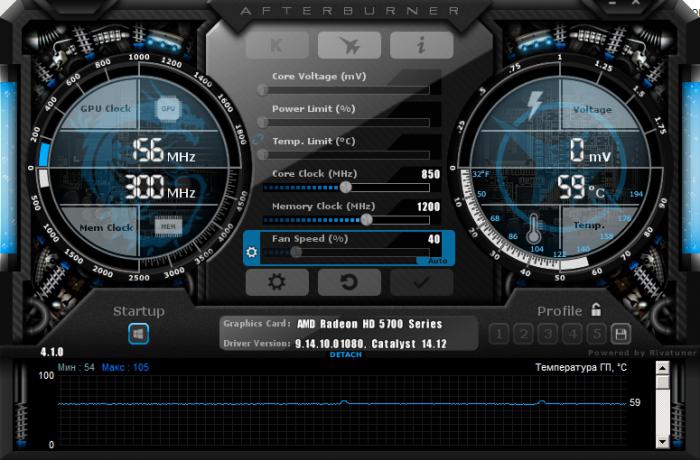
This program for measuring processor temperature for Windows 7 has flexible settings, because not everyone needs the information that is provided by default. To change the number of graphs and their sets, you need to go to the settings by clicking on the gear icon. Then you will need to go to the “Monitoring” tab, where you can check or uncheck the required items.
By clicking the "Minimize" button, you will see that the application will hide in the tray. When running full-screen video games or programs that use a video accelerator, the temperature of the video card will be displayed in the upper left corner on top of all windows. This approach is very convenient for testing the device under load.

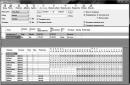
AIDA64
Perhaps the most famous program for measuring processor temperature in Russian. I must say that this is not all of its functionality. The application provides the most comprehensive information about the hardware, from that which the driver allows you to obtain, and ending with that provided by the BIOS and sensors installed in the controllers.
However, let's focus on the main thing - temperature monitoring. Pay attention to the character strip that is at the top. There is an icon with a diagram, you need to click on it. After clicking, a window will open with the default settings set by the program manufacturer. It must be said that the initial configuration monitors not all parts of the PC, but the most important ones.
You can change the number of graphs and configure them by clicking on the "Settings" button (or Preferences, if you are using the English version). In the utility that opens, it is possible to enable diagrams for each sensor inside the computer. For example, a program for measuring the temperature of a laptop processor and video card suggests choosing not just the CPU, but also each of its cores separately.
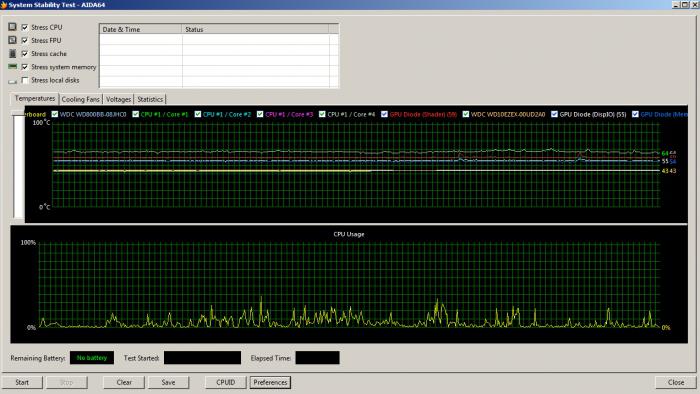
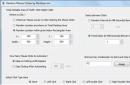
Stress test
It must be said that viewing information about the temperature of the main parts of the PC will not give anything if you perform the check during idle time (that is, with a minimum of programs running). If you run a “heavy” full-screen application, the system will shut down due to overheating, leaving the user wondering: was there really an excess of peak values or should the problem be looked for elsewhere?
This means that monitoring and booting the computer must be performed simultaneously. Not every measurement program provides such functionality. For example, Afterburner displays information only when running full-screen applications. Data in SpeedFan and HWMonitor can only be read when the user switches to their windows. AIDA64, in contrast, simplifies the task and allows you to run a stress test.
This name hides a special tool that will load the system as much as possible, showing the user how this affects the temperature of the devices and their power consumption.
Running the test
To run this check, click on the same charts icon. Pay attention to the left top corner window. There is a list of devices, and there are checkboxes next to them. This identifies the components that will be tested. It is advisable not to apply such measures to the hard drive, although this is possible.
After checking the boxes, click on the "Start" button. At this time, computer testing will begin. It is advisable not to leave the monitor at this time and follow the diagrams. If the bar of any graph sharply creeps up and exceeds a critical value, it is better to immediately disable the test to avoid equipment breakdown, because the problem can be considered identified.
It is precisely because of the implementation of the stress test that many believe that AIDA64 is the best program for measuring processor temperature in Russian.