The main feature that separates a professional trader from a beginner is the ability for self-criticism and introspection.
The fact is that for all the mistakes that a trader makes, you have to pay with both money and precious time.
Naturally, in order not to lose either one or the other, a trader must constantly work on mistakes, keep trading statistics and, most importantly, analyze a particular situation that led to an unfavorable outcome.
Moreover, self-analysis allows you not only to understand the reason for the loss of funds, but also to identify both strong and weak sides strategies. Sometimes it is enough not to make transactions at a certain time of day for the overall trading result to radically change in the opposite direction.
Trade big only with a leading broker
And if earlier it was difficult to carry out self-analysis, since it took a lot of time, now, with the help of special programs, it can be carried out in a matter of minutes. Actually, in this article you will get acquainted with one of such programs that will help you with this.
SQ EA Analyzer program. Installation
The SQ EA Analyzer program is a program that allows you to analyze a trader’s strategy based on his report from the MT4 trading terminal.
Unlike a standard report that every trader can make, the information in SQ EA Analyzer is much broader; moreover, you can use it to model the behavior of a strategy when certain conditions are excluded or added.
The SQ EA Analyzer software applies to free of charge, however, in order to use it you will need to enter your login and email on the official website of the developer - https://strategyquant.com/quantanalyzer/free/.
After confirming your subscription, you will receive a key to the program in a message, as well as a download link depending on your operating system.
The installation principle itself is no different from installing any other program, namely, you will need to run installation file, indicate the folder where the program will be unpacked, and also agree to the user agreement.
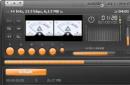
When you launch it for the first time, the program will require a key, which you received directly by email when you subscribed. After the first launch, the program will look like this:

Getting started with SQ EA Analyzer. Basic functions
The SQ EA Analyzer program works with source data that is generated either through Excel or in the form of an MT4 report. Therefore, the first thing you need to do is generate a trading report in your MT4 and save it.
After you have generated the report, you need to load it into the program. To do this, in the top line of options, click on the “Load Report” button and load the previously saved template from MT4.

After you download your report, on the left line click on the “Analyze” option. A series of tabs will appear in front of you, including basic information according to your trading strategy you can get in the tab called Overview.
It directly contains data on total profit, profit in points, Sharpe ratio, profit factor, drawdown data, ratio of profit to drawdown, average monthly and daily profit, mathematical expectation.
Also in this tab you can see information on the ratio of unprofitable to profitable transactions, the ratio of average profit to average loss, exposure, stagnation in percentage and days. This tab also contains a number of other strategy performance indicators that we have not listed.

A trader can get more in-depth information about his trading strategy in the “Trade analisys” tab.
It is in this tab that in graphical form, with the help of charts and other graphs, it shows the trader information on the duration of transactions and their relationship with profit, profit and loss by day, hour and month, the ratio of profit factors of long and short transactions, the ratio of profit and loss and much more.

Thanks to the SQ EA Analyzer program, you can find out how stable your Forex trading strategy is and to what extent you can expect an increase in drawdown and a decrease in profits. To do this, it contains a simulator using the Monte Carlo method.
The essence of the algorithm is that it swaps transactions or skips some of them. In order to use the algorithm in the left column, enter the “Monte Carlo Analisys” menu and then click on the Run button.
After the analysis, you will receive a column with the results, as well as graphs of the possible behavior of the strategy in the future:

No less useful for traders than the Monte Carlo simulator is the simulation of possible results if you would implement some additional conditions.
In order to use this function, in the left column, enter the “What if analisys” menu.
A window will appear in front of you in which you can set modeling conditions, namely on what days and hours to exclude transactions, limit the number of transactions per day or filter out transactions that were opened on different instruments at the same time, as well as a number of other conditions .
In conclusion, I would like to note that the SQ EA Analyzer program is truly powerful application, which allows you to analyze your own trading and draw the necessary conclusions. The only drawback of the program is the lack of a Russian-language interface.
Statistics are very important for system and algorithmic traders. EA Analyzer Pro is a Forex trading analysis program that provides advanced testing results for advisors and manual trading vehicles. Of course, trading terminal advisors issue a detailed report and show a graph of trading efficiency, however, programs for testing Forex systems such as Ea Analyzer are capable of displaying much more information that will help change the trader’s approach to his system and keep temporary deposit drawdowns under control.
You can download the Forex program for free at the end of this review or on the developer’s website. Before proceeding with the description of the program itself, you should load the results of transactions of advisors or strategies into it. For convenience, you can use trading.
All examples are given on build 3.0.0, but today there are updated versions. You can also pay attention to Ea Analyzer in Russian, which has established itself as a reliable Forex program for trading and analytics. Of course, the Forex program in Russian is somewhat different from the original, but in terms of functionality it is not inferior to it. Ea Analyzer can be downloaded for free on the official website - versions with build 3.0.0 are provided for 32 and 64-bit PC operating systems. EA Analyzer can also be downloaded as a torrent.
Analyzer: Data Loading
First of all, you need to open the trading terminal and click on the “Strategy Tester” icon or type the command Ctrl+R. After that, an advisor window will appear at the bottom of the terminal, which should be configured at your discretion. Basic settings should be made in the following tabs:
- Advisor (select an advisor or indicator);
- Symbol (trading instrument);
- Model (recommended setting “All ticks”);
- Date (setting the system testing period);
- Expert Advisor properties (a menu that allows you to change the deposit, lot volume and other important parameters);
- Time period (timeframe).
After setting all the parameters, you should click the “Start” button, wait until the end of the test and go to the “Results” tab. Next, you can select the results you are interested in and save them in HTML format to any convenient folder.

It is also possible to save multiple reports by trying the advisor with different settings or with different currency pairs.
Ea Analyzer: how to use
To load data, open the analyzer window and select the “Load” tab.

After clicking the icon, a window will appear in which you should select the results of interest and load them into the analyzer.

Analyzer interface
In order for a trader to be able to fully use this program, its interface should be described in detail.
Top icons:
- Load – allows you to load strategy reports;
- Results in money – change the display of financial results (pips, interest, deposit);
- Our other products – a list of other company developments;
- Quant Editor – access to the editor, allows you to change the source code.
First of all, you should consider the displayed trading data:
- Selecting a report by date;
- Total income;
- Earnings in pips;
- Average annual profit;
- Average profit as a percentage.
Designation of icons with detailed statistics:
- Number of orders;
- Sharpe ratio;
- Trade efficiency. (If the value is less than 1, trading is considered ineffective);
- Ratio of average earnings to losses;
- The ratio of profitable trades to total ones – it is desirable that the data show a value of more than 50%;
- Drawdown;
- Drawdown as a percentage;
- Average daily profit;
- Average monthly income;
- Average profit per transaction;
- Percentage ratio of income to drawdown;
- Mathematical expectation – the lower the number, the better;
- Mathematical expectation depending on the number of trades;
- Trade quality indicator;
- Trade rating indicator – you can change the number of transactions, which will change the rating indicators.
Using scrolling, you can see detailed statistics displaying the following data:
- Number of profitable trades to unprofitable ones;
- The ratio of average profit to average loss;
- A measure of deviation from the mean;
- The number of days of stagnation - when trading did not bring profit;
- Stagnation percentage – shows trading efficiency;
- Distribution of profits and losses by month.
You also need to pay attention to other program bookmarks.
List Of Trades
This tab shows the parameters of completed transactions, and in particular:
- Currency pair;
- Timeframe;
- Market order direction;
- Position opening time;
- Quote price at the time of position opening;
- Lot volume;
- Time to exit the position;
- Price at the time of order closure;
Also in this column you can see information about the profitability of transactions in percentage terms, points and in monetary terms.

Equity chart
This tab shows a graph of the effectiveness of a trading system or advisor. The information is displayed as a broken line. This chart can include several reports at once and analyze the effectiveness of several strategies simultaneously. There are also transaction settings that allow you to select positions exclusively for buying or selling.

Trade analysis
Quite an informative and useful bookmark for a trader. In it you can see which hours were profitable or unprofitable in trading, as well as positive and negative days of the week.
By clicking on the small flag, you can analyze the histogram, which displays the profit, the profit ratio of short and long trades for the year, by day of the week, etc.

Settings
Advisor settings. In cases where a trader is analyzing manual trading, only the initial deposit will be displayed in this window.

Monte Carlo
This tab allows you to test the trading system for stability. It is possible to swap orders or exclude some of them randomly within a certain percentage. After certain changes in strategy, it is easier for an investor to choose optimal settings advisors or upgrade the mechanical trading system.

What if scenario
These settings allow you to exclude certain trading days from the strategy. You can also add restrictions in the form of opening buy or sell orders. It is worth noting that this function can serve as an excellent filter and allows you to identify ineffective trading in a given situation.

Summarizing
As is clear from the review, Ea Analyzer for Windows is a powerful tool with which you can improve your trading skills, filter out unfavorable times for opening positions and select an effective trading instrument with the maximum mathematical expectation.
Used in real money trading should be fully studied by the trader. But not everyone always understands the meaning of certain parameters of the system, and when it begins to cause losses, they cannot determine the reason for the change in its behavior. Since the market is changeable, from time to time any trading system also needs to be changed and adjusted to new conditions. For example, change indicator settings during market stagnation, which was preceded by active movement, time frame, or adjust other points in order to resume profitable trading.
StrategyQuant has created a unique program, EA Analyzer, designed to conduct in-depth analysis of trading systems, both manual and automatic. The analysis is carried out on the basis of reports received in . On the official StrategyQuant website you can download a demo version of the program; the website offers a free, more early version, which differs slightly, but you can use it for an unlimited time.
To use strategy tester EA Analyzer To analyze your trading systems, you need to understand the program, its interface, and functionality. This is what this article will be devoted to.
Features of the EA Analyzer program.
So, you can download the program from the following link:
Download ea-analyzer.rar (downloads: 745)
After downloading, the standard procedure for installing the program on your computer is carried out. Looks like installed program as follows (the image can be enlarged by clicking):
Rice. 1. Interface of the EA Analyzer program.The program menu contains 9 blocks, each of which has a specific function. Below we will go through all the tabs.
A distinctive feature of EA Analyzer is the implementation of a more detailed analysis of the results of the trading system compared to the standard capabilities of the MT4 trading terminal. It also allows you to make summary statements of the work of experts for several trading instruments, while simultaneously combining the results of the work of all advisors in one report. The report contains detailed statistical characteristics of trading, in particular, which are not available in the report obtained in the MetaTrader 4 terminal: monthly and annual profitability of the system, graphs of profits, losses, depending on the day of the week, hour of entry into the market, number of transactions by hour, duration of transactions and other data in graphical form.
After the trading system is run in the MetaTrader 4 trading terminal, it must be saved in .htm format. The report file is loaded into the program by clicking on the Load button and selecting the file through the data upload form (clickable image):
 Rice. 2. Loading the advisor's work report into the EA Analyzer program.
 Immediately after loading, a history analysis of the system’s operation is generated. Let's take a closer look at the values presented in the analyzer fields.
EA Analyzer functionality.
The first Overview information block provides information on indicators that describe the overall picture of the analysis results, in particular:
- - Total Profit - total profitability of the system (in points, percentage and currency);
- - Profit in pips - total profit in points;
- - Yearly avg profit - average annual profitability. The indicator will be informative only if trading was carried out all the time by one;
- - Yearlyavg % return - average annual return as a percentage of the deposit;
- - # of trades - total number of trades;
- - Sharpe ratio - statistical coefficient, a secondary characteristic of the account;
- - Profitfactor is the main statistical indicator, a kind of strategy profitability factor. If the value is less than 1.6, the strategy is considered to be ineffective. If the value is greater than 3, the strategy can be classified as aggressive, and therefore dangerous;
- - Return/DDratio - the ratio of average profit to drawdown. The lower the value, the more transactions are “overstayed”. The higher the indicator, the better;
- - Winning percentage - percentage of winning transactions in relation to their total number;
- - Drawdown - absolute drawdown of the deposit according to the strategy;
- - % drawdown - absolute drawdown in percentage terms;
- - Daily avg profit and Monthly avg profit - average daily and monthly profitability. Can be expressed in currency, points or %;
- - Average trade - average trade. A negative value indicates the inefficiency of the system;
- - Annual %/MaxDD% - percentage ratio of profit from the initial deposit to drawdown. Everything is calculated as a percentage. Determines the effectiveness of the strategy;
- - R expectancy - expected value relative to the average risk;
- - Rexpectancyscore - the previous indicator is divided by the number of completed transactions;
- - Strategy quality number - quality rating assigned by the strategy program based on statistical characteristics;
- - SQNscore - similar to the previous indicator, only tied to the number of transactions (enlarge the screen if necessary):
Below is the STATS block with its own set of parameters:
- - Wins/lossesratio - the ratio of transactions closed with profit to unprofitable ones;
- - Payoutratio (avgwin/loss) - the ratio of average profit to average loss;
- - Average # barsintrade - the average number of bars in one trade, that is, for how many candles on average one trade is open;
- - Z-score - determines the deviation from the average value of the operation result. If the value is positive, after a profitable transaction there is a losing one, with negative value- after a profitable one, a profitable transaction comes again. The more the indicator is zero, the higher the likelihood of what is said;
- - Expectancy - an indicator characterizing the expected value of the system and showing the average profitability of each transaction in the future;
- - Deviation - standard deviation from the expectation. The lower the indicator, the better, the smoother the system’s growth graph will be;
- - Stagnation in days - stagnation in days, that is, how many days the system works with income equal to zero;
- - Stagnationin - stagnation expressed as a percentage in relation to the total operating time of the strategy (screen clickable):
In the block below you can see the already familiar characteristics that the report produces in the MT4 terminal. Unless the indicators Avg # ofbarsinlosses and Avg # ofbarsinwins will be new, expressing the average number of bars in loss and profit. Even lower, a table is built with the distribution of profit/loss not only by month, but also by year. The next tab in the main menu is List of Trades. This will display a table similar to a report from the MT4 platform, which collects all trades organized by date. The table consists of the following blocks:
- - Ticket - order ticket;
- - Symbol - symbol of a trading instrument;
- - Timeframe - chart time frame;
- - Type - order type;
- - Opentime - time of opening a deal;
- - Openprice - transaction opening price;
- - Size - transaction size in lots;
- - Closetime - order closing time;
- - Closeprice - order closing price;
- - Timeintrade - the time during which the transaction was in the market;
- - Cumulative P/L;
- - P/L in money - the result of the transaction, expressed in currency;
- - Cumulative money P/L;
- - P/L in pips - ratio of profit to loss in points;
- - Cumulativepips P/L ;
- - P/Lin% - ratio of profit to loss as a percentage;
- - Cumulative P/L %;
- - Comment - comment on the order (image enlarges):
Clicking on the Manage view button opens a window whose functionality allows you to change the view of this table and display only those parameters that are interesting to the trader. The third tab is Equity chart. The balance graph will be displayed here, and if a trader has downloaded several reports within one portfolio, then all reports will be displayed. You can choose to display the chart only for sell or buy transactions, enable or disable highlighting the period when stagnation was observed, and the method of displaying the drawdown (display/not display, in monetary terms, in points or as a percentage). Checking the drawlines checkbox will result in drawing a trend line on the chart (the image can be enlarged):
 Rice. 6. View of the balance graph in the EA Analyzer program.
 The Trade Analysis block is of particular interest. Here is a chart of returns by year. The functionality of the section allows you to select any of 20 types of graphs to display the necessary statistical information (enlarge if necessary):
 Rice. 7. Graphs with statistical characteristics of the system.
 You can display information on the screen in graphical form on indicators such as:
- - Tradesbyhour/weekday/day/month/year - number of trades by hour/day of the week/day of the month/month of the year/year;
- - Tradesbyduration - transactions according to the duration of their stay on the market;
- - P/Lbyhour/weekday/day/month/tradeduration - profit/loss by hours/days of the week/days of the month/months/by duration;
- - Longvsshorttrades - the ratio of buy trades to sell trades;
- - Longsvsshorts P/L - the ratio of profit factors of buy trades to sell trades;
- - Profit/loss - profit to loss ratio;
- - Longprofit/loss and Shortprofit/loss - the ratio of total profit to loss only for buy transactions or only for sell transactions;
- - Wins/lossesbyhour, day, weekday, month - profitable and unprofitable trades by hour, day, month;
- - Wins/lossesprofitbyhour, day, weekday, month - profit and loss in currency, also depending on the period.
The final report may contain 6 different graphs.
The next section is Settings. The advisor settings will be displayed here if the automatic expert report was loaded into the program. If the program analyzes a manual strategy, only the initial deposit will be displayed. When setting a custom initial deposit in the Initialdeposit field, you will need to recalculate the characteristics for the report by clicking on the Recomputestats button.
In the block called Monte Carlo, you can run a system analysis using the Monte Carlo method, which checks the advisor for stability when changing certain settings:
 Rice. 8. Graph of system indicators after analysis using the Monte Carlo method.
 This allows you to evaluate the system under conditions closer to reality. The algorithm can be used in two versions:
- - swap deals in random order. This approach demonstrates the behavior of the system if the market were slightly different. Such an analysis is carried out in order to assess the limits of the maximum drawdown;
- - the probability parameter can be used to specify the skipping of a certain number of transactions selected at random. Imitation of a case where a trader missed them for one reason or another.
The methods can be used one at a time or in combination. A graph of possible developments will be displayed in the window on the left. The closer the graph lines are to the main line, the more stable the system is.
Interesting features of the program are implemented in the What if scenario? block. (What if the scenario?) - how would the profitability of the system change if its scenario changed. The following exceptions can be set:
- - trading only on certain days;
- - trading only at certain hours;
- - carrying out transactions only for purchase or only for sale;
- - exclusion of transactions with maximum/minimum profit from the report;
- - exclusion of transactions that are on the market at the same time;
- - do not take into account in the report operations to replenish the account and withdraw funds, as well as transactions with zero results;
- - use only every second transaction in the report;
- - use a certain number of transactions during the day;
- - use a fixed lot (click to enlarge):
Perhaps, with some exceptions, the system will show greater efficiency and profitability.
The Equity control section displays a graph where you can monitor your equity level. Control is carried out on the basis of indicators plotted on the chart. The main purpose of this function is to improve system performance and reduce drawdowns:
 Rice. 10. Chart in the Equity control section.
 The Portfolio Analysis section provides the ability to analyze the correlation of transactions simultaneously from several reports loaded into the program. It also displays information about the number of transactions opened simultaneously on several instruments.
If you understand programming, the built-in editor QuantEditor will be useful. You can program your own scenario in it, which can be used in the analysis in the Monte Carlo or What if scenario? sections. . The editor opens up wide opportunities for better analysis of the trading system.
The EA Analyzer program will be useful for those traders who want to improve their strategy as much as possible and sort out their mistakes to achieve the best trading results.
Surely, many of you watched the comedy by Harold Ramis about the life of New York mafioso Paul Vitti played by Robert De Niro. Paul is on the verge of a nervous breakdown until his car is accidentally hit by the car of the psychoanalyst who later changes his life.
We can experience the same dramatic changes when we encounter the EA Analyzer program. After all, the profession of a trader is also not an easy one and requires a serious analytical approach. EA Analyzer is designed to handle all the analytical part and save you from unnecessary emotional distress.
Powerful statistical analysis will allow you to identify and correct errors in your strategy in a timely manner. Any minor mistake can lead to colossal losses in the long term. This is why it is so important to get all aspects of your strategy right.

EA Analyzer provides a broad analysis of your market performance. It also groups advisor reports into one easy-to-use statement. All necessary statistics, including the amount of profit depending on time indicators, are displayed on charts that are quite easy to understand.
Also included is a function that shows possible scenarios for the development of events when we make possible alternative decisions.
To work with the program, you first need to create a report that can be analyzed. This can be easily done, for example, in MetaTrader4. Unfortunately, the program has not yet been translated for the Russian user, so possible hiccups cannot be ruled out during the initial study of the menu.
The menu provides us with the opportunity to generally consider the dynamics of profit or loss from all possible angles. There's even a feature included that assigns a score to your strategy based on its success. In addition, the program can calculate the mathematical expectation of your strategy, which is quite convenient when structuring future tasks.
The ability to use tools such as transaction tables, balance charts, as well as bar and pie charts is included, thanks to which you can analyze your trade.
The analysis of the system using the Monte Carlo method deserves special mention. This algorithm allows you to show the behavior of the system when its parameters change. Thanks to the Monte Carloma method, we can see what to expect from the system in a given situation, what are the risks of maximum drawdown, how stable the system itself is, and much more. Moreover, in a special built-in editor, QuantEditor, a trader will be able to independently program all sorts of scenarios that may be of interest to him.
Thus, the EA Analyzer program can be an excellent assistant when analyzing or developing your own strategy.
Forming a trading strategy requires taking into account many criteria that we rarely think about. For example, the vast majority of traders, when developing trading tactics, pay attention to the entry point and, at best, the exit point.
However, few of us think about the profitability of tactics depending on the trading session, day and even season. Also, few traders pay attention to the duration of the transaction, and this is a very important characteristic that is mentioned in more than one stock book.
After all, everything is banally simple - a successful transaction is in the black almost from the first minutes, when multi-day stuck orders bring only losses.
Naturally, if we do not pay attention to all these factors in the process of developing a strategy, then at the moment when the tactics begin to fail and cause losses, we immediately abandon it and look for something new.
However, if we had carried out a more in-depth analysis of it, we could have eliminated the shortcoming, and even improved the strategy many times over.
EA Analyzer is a forex trading strategy testing program that can help you analyze your trading history to identify the strengths and weaknesses of your tactics, as well as perform a more in-depth analysis to improve your strategy. EA Analyzer allows you to find out how stable your tactics are if market conditions change, and you can easily simulate this situation.
Installing EA Analyzer
EA Analyzer is an independent program, so installing it is no different from installing games and programs on your computer. It should be noted that at the end of the article you will find a download archive, which contains two versions of the program, namely for 32 or 64 bit Windows versions.
Be sure to install only the version that is installed on your computer, since the program will simply give an error and will not start. It is also worth understanding that EA Analyzer is an English-language program, so you may have difficulties in using it at the first stage. So, after running the program you will get this look:

Working with the program. Basic functions
In order for the program to begin analyzing your trading strategy, it will need historical data on transactions. You can download reports both in CSV format and the format that the MT4 report gives us. So, first of all, generate a report for the period of interest in the MT4 trading terminal.
The next step is to click on the “Load” button, after which a additional window in which you will need to select the path where the MT4 report is located on your computer.

Once downloaded, EA Analyzer will automatically analyze the strategy data. On the top line you can see nine different tabs, by opening which you can get acquainted with important information and also conduct some experiments with strategy. So, let's take a brief look at the main tabs and their purpose.
Overview Tab
The first, and also the most important, tab contains basic information on the account and strategy, namely various mathematical indicators. So, you can see data on total profit (total profit), total number of transactions, Sharpe ratio, drawdown in points and drawdown in percentage, average profit for the year and average annual percentage of profit, profit factor, ratio of average profit to drawdown and many other coefficients and whose data is not in the standard report.
Also in this tab you can see more specific information on the strategy itself, namely the mathematical expectation of the system, exposure, stagnation in days and percentages, standard deviation from the mathematical expectation and others.

List of trades tab
This tab looks like a table, inside of which are all the transactions you have made with their results. Actually, this tab is only necessary for editing transactions, for example, if you want to delete data on a particular transaction or, on the contrary, add it. Your future report directly depends on how full the table is with transactions.

Equity chart tab
In this tab you can see a graph of your balance, as well as drawdowns. It is worth noting that this tab allows you to visualize the profitability of your account if you download several reports in order to see how a portfolio of strategies or advisors is performing.

Trade analysis tab
This tab is especially useful if you want to know all the intricacies of your strategy, as well as see those moments when the strategy brings profit and when it loses. So, in this section you can see information in the form of charts on the duration of transactions, on the effectiveness of the strategy at certain hours and days, on the ratio of buy or sell positions.

Monte carlo tab
In this tab, you can check the stability of your trading strategy, namely if market conditions change dramatically. To do this, a special calculation algorithm is used using the Monte Carlo method, during which you will find out the likely drawdown (the range in which the strategy will work) as well as the possible profit.