All Windows systems, when a fatal error is detected, make a crash dump (snapshot) of the contents random access memory and saves it to your hard drive. There are three types of memory dump:
Full memory dump – saves the entire contents of RAM. The image size is equal to the size of RAM + 1 MB (header). Very rarely used, as on systems with large amounts of memory the dump size will be too large.
Kernel memory dump – saves RAM information related to kernel mode only. User mode information is not saved because it does not contain information about the cause of the system crash. The size of the dump file depends on the size of the RAM and varies from 50 MB (for systems with 128 MB of RAM) to 800 MB (for systems with 8 GB of RAM).
Small memory dump (mini dump) - contains a fairly small amount of information: an error code with parameters, a list of drivers loaded into RAM at the time of the system crash, etc., but this information is enough to identify the faulty driver. Another advantage of this type of dump is the small file size.
System Setup
To identify the driver that caused it, it will be enough for us to use a small memory dump. In order for the system to save a mini dump during a crash, you must perform the following steps:
| For Windows Xp | For Windows 7 |
|
|
Having completed all the manipulations, after each BSoD a file with the extension .dmp will be saved in the C:\WINDOWS\Minidump folder. I advise you to read the material "". You can also check the box “ Replace existing file dump" In this case, each new crash dump will be written over the old one. I do not recommend enabling this option.
Analyzing a crash dump using BlueScreenView
So, after the Blue Screen of Death appeared, the system saved a new crash memory dump. To analyze the dump, I recommend using the BlueScreenView program. It can be downloaded for free. The program is quite convenient and has an intuitive interface. After installing it, the first thing you need to do is specify the location for storing memory dumps on the system. To do this, go to the menu item “ Options” and select “ AdvancedOptions" Select the radio button “ LoadfromthefollowingMini Dumpfolder” and specify the folder in which the dumps are stored. If the files are stored in the C:\WINDOWS\Minidump folder, you can click the “ Default" Click OK and get to the program interface.

The program consists of three main blocks:
- Main menu block and control panel;
- Crash dump list block;
- Depending on the selected parameters, it may contain:
- a list of all drivers in RAM before the blue screen appears (by default);
- a list of drivers located in the RAM stack;
- BSoD screenshot;
- and other values that we will not use.

In the memory dump list block (marked with number 2 in the figure), select the dump we are interested in and look at the list of drivers that were loaded into RAM (marked with number 3 in the figure). The drivers that were on the memory stack are colored pink. They are the cause of BSoD. Next, go to the Main Menu of the driver, determine which device or program they belong to. First of all, pay attention to system files, because system files are loaded in RAM in any case. It's easy to see that the faulty driver in the image is myfault.sys. I will say that this program was specifically launched to cause a Stop error. After identifying the faulty driver, you need to either update it or remove it from the system.
In order for the program to show a list of drivers located on the memory stack when a BSoD occurs, you need to go to the menu item “ Options“click on menu” LowerPaneMode” and select “ OnlyDriversFoundInStack” (or press the F7 key), and to show a screenshot of the error, select “ BlueScreeninXPStyle” (F8). To return to the list of all drivers, you must select “ AllDrivers” (F6).
In Windows 8, Microsoft introduced a new memory dump - an automatic memory dump option. This setting is set by default in the operating system. Windows 10 introduced a new type of dump file - active memory dump. For those who don't know, in Windows 7 we have small dump, core dump and full core dump. You might be wondering why Microsoft decided to create this new memory dump option? According to Robert Simpkins, senior support engineer, an automatic memory dump can create support for the “system” page in the configuration file.
The paging file configuration management system is responsible for managing the size of the paging file - this avoids unnecessary headroom or paging file size. This option is introduced mainly for PCs that run on SSD drives, which tend to be smaller in size but have a huge amount of RAM.
Memory dump options
The main advantage of “Automatic memory dump” is that it will allow the subsystem session in the process manager to automatically reduce the page file to a size smaller than the size of RAM. For those who don't know, the subsystem manager session is responsible for system initialization, the startup environment for services and processes that are required for the user to log into the system. It basically installs a page of files into virtual memory and starts the winlogon.exe process.
If you want to change your automatic memory dump settings, here's how to do it. Click Windows keys+ X and select - System. Next, click on the button “Advanced system settings - Advance System Settings”.
Click on the Advanced system settings button.

Here you can see a drop-down menu where it says “Advanced”.

Here you can select the option you want. Suggested options:
No memory dumps.
Small memory dump.
Kernel memory dump.
Complete memory dump.
Automatic memory dump. Added to Windows 8.
Active memory dump. Added to Windows 10.
The location of the memory dump file is in the %SystemRoot%\MEMORY.DMP file.
If you are using SSD drive, then it’s better to leave it on “Automatic memory dump”; but if you need a crash dump file, then it's better to set it to “small memory dump”, with it you can, if you want, send it to someone so they can take a look at it.
In some cases, you may need to increase the size of the page file larger than the RAM so that it can fit a full memory dump. In such cases, you need to create a registry key:
HKEY_LOCAL_MACHINE\SYSTEM\CurrentControlSet\Control\CrashControl
it's called "LastCrashTime".
This will automatically increase the size of the swap file. To reduce it later, you can simply remove this key.
Windows 10 has introduced a new dump file called active memory dump. It contains only the essentials and is therefore smaller in size.
I don't have a way to test it, but I created this key and monitored the page file size. I know that sooner or later I will get a critical error. Then I'll check it.

You can analyze the dump Windows memory.dmp files via WhoCrashed. WhoCrashed Home is a free utility that provides drivers that have been installed into your computer with one click. In most cases, it can identify a faulty driver that is causing problems to your computer. This is a system analysis crash dump, memory dumps, and all the collected information is presented here in an accessible form.

Typically, the debugging toolkit will open an analysis crash dump. With this utility, you don't need any knowledge or debugging skills to find out which drivers are causing problems on your computer.
WhoCrashed relies on a debugging package (the windbg program) from Microsoft. If this package is not installed, WhoCrashed will download and automatically extract this package for you. Just run the program and click on the Analyze button. When you have WhoCrashed installed on your system and if it crashes or closes unexpectedly, the program will let you know if crash dumping is enabled on your computer and it will offer you suggestions on how to enable them.
In chapter A crash dump is defined by the following parameters:
– REG_DWORD-parameter AutoReboot with meaning 0x1(option Perform automatic reboot subwindow window Properties of the system);
– REG_DWORD-parameter CrashDumpEnabled with meaning 0x0, if a memory dump is not created; 0x1 – Full memory dump; 0x2 – Kernel memory dump; 0x3 – Small memory dump (64KB);
– REG_EXPAND_SZ-parameter DumpFile with meaning %SystemRoot%\MEMORY.DMP(dump file storage location);
– REG_DWORD-parameter LogEvent with meaning 0x1(option Log event window );
– REG_EXPAND_SZ-parameter MinidumpDir with meaning %SystemRoot%\Minidump(optional);
– REG_DWORD-parameter Overwrite with meaning 0x1(option Replace existing file window );
– REG_DWORD-parameter SendAlert with meaning 0x1(option Send an administrative alert window ).
How the system creates an emergency memory file
During boot, the operating system checks the emergency creation parameters in the registry section . If at least one parameter is specified, the system generates a map of disk blocks occupied on the boot volume and stores it in memory. The system also determines which disk device manages the boot volume, calculates checksums for the image in memory and for data structures that must be integer to be able to perform I/O operations.
After a failure, the system kernel checks the integrity of the page file map, disk file and disk control structures. If the integrity of these structures is not violated, then the system kernel calls special disk I/O functions , designed to save a memory image after a failure. These I/O functions are self-contained and do not rely on kernel services because the programs responsible for writing the crash dump cannot make any assumptions about which parts of the system kernel or devices were damaged when a crash occurred. The system kernel writes data from memory to the paging file sector map (it does not have to usefile system).
First, the system kernel checks the status of each component involved in the dump process. This is done so that when writing directly to disk sectors, the data located outside the file is not damaged. File size should be 1 MB larger than the size of physical memory, because when information is written to, a header is created that contains the emergency signature and the values of several important system kernel variables. Title occupies less than 1 MB, but the operating system can increase (or decrease) the size of the paging file by at least 1 MB.
After system boot Session Manager (Windows NT Session Manager; disk address – \WINDOWS\system32\smss.exe) initializes system files, using its own function to create each file NtCreatePagingFile. NtCreatePagingFile determines whether the file being initialized exists, and if so, whether it has a header . If there is a title, then NtCreatePagingFile sends to Session Manager special code. After that Session Manager starts the process Winlogon (Login program Windows system NT; disk address – \WINDOWS\system32\winlogon.exe), which is notified of the existence of an emergency . Winlogon starts the program SaveDump (Windows NT Memory Copy Program; disk address – \WINDOWS\system32\savedump.exe), which parses the header and defines further actions in an emergency.
If the title indicates the existence , That SaveDump copies data from a file to an emergency file whose name is specified REG_EXPAND_SZ-parameter DumpFile section . Bye SaveDump rewrites the file , the operating system does not use the part of the page file that contains the emergency . During this time, the amount of virtual memory available to the system and applications is reduced by (At the same time, messages may appear on the screen indicating a lack of virtual memory). Then SaveDump informs the memory manager that the save is complete , and he releases that part file in which it is stored , for general use.
Saving the file , program SaveDump records the creation of an emergency in the event log , for example: “The computer was rebooted after a critical error: 0x100000d1 (0xc84d90a6, 0x00000010, 0x00000000, 0xc84d90a6). Memory copy saved: C:\WINDOWS\Minidump\Mini060309-01.dmp" .
Full memory dump writes the entire contents of memory when a fatal error occurs. For this option, you must have a paging file on the boot volume, the size of which is equal to the amount of all physical RAM plus 1 MB. Default full memory is written to a file %SystemRoot%\Memory.dmp. If a new error occurs and a new complete file is created memory (or kernel memory) the previous file is replaced (overwritten). Parameter Full memory dump not available on systems running a 32-bit operating system and 2 or more RAM.
If a new error occurs and a new complete file is created memory the previous file is replaced.
Kernel memory dump writes only kernel memory, making the process of writing data to the log when the system suddenly stops proceeds faster. Depending on the amount of physical memoryin this case the page file requires 50 to 800 MB or one third of the physical memory on the boot volume. kernel memory is written to a file %SystemRoot%\Memory.dmp.
This does not include unallocated memory or memory allocated to mode programs. It only includes memory allocated to the kernel and hardware-specific layer ( HAL) V Windows 2000 and later versions of the system, as well as memory allocated for kernel mode and other kernel mode programs. In most cases this is the most preferred option. It takes up much less space compared to a full memory, while excluding only those memory sectors that are most likely not associated with the error.
When a new error occurs and a new file is created kernel memory the previous file is replaced.
Small memory dump writes the smallest volume useful information necessary to determine the cause of the problem. To create a small memory requires that the page file size be at least 2 MB on the boot volume.
Small files memory contains the following information:
– message about a fatal error, its parameters and other data;
– list of downloaded ;
– context ( PRCB) on which the failure occurred;
EPROCESS) for the process that caused the error;
– process information and kernel context ( ETHREAD) for the thread that caused the error;
– Kernel mode call stack for the thread that caused the error.
Small file memory is used when hard disk space is limited. However, due to the limited information it contains, analysis of this file may not always detect errors that were not directly caused by the thread running at the time the error occurred.
If the following error occurs and a second small file is created memory, the previous file is retained. To each additional file a unique name is given. The date is encoded in the file name. For example, Mini051509-01.dmp- this is the first file memory, created on May 15, 2009 List of all small files memory is stored in a folder %SystemRoot%\Minidump.
operating system , undoubtedly, much more reliable than previous versions - thanks to the efforts of both developers Microsoft, both hardware developers and application software developers . However, emergency situations - all kinds of failures and system crashes - are inevitable, and depending on whether theknowledge and skills in eliminating them, it depends whether he will have to spend a few minutes troubleshooting (for example, updating/debugging or reinstalling the application program that is causing the failure), or several hours reinstalling/configuring operating system and application software (which does not guarantee the absence of failures and crashes in the future!).
Many administrators neglect to analyze crash dumps Windows , believing that working with them is too difficult. It’s difficult, but it’s possible: even if, for example, the analysis of one out of ten will be successful - the efforts spent on mastering the simplest techniques for analyzing emergency situations , will not be in vain!..
Errors very often occur in Windows OS, even in the case of a “clean” system. If ordinary program errors can be solved (a message about a missing component appears), then critical errors will be much more difficult to fix.
What is a memory dump in Windows
To solve problems with the system, a crash memory dump is usually used - this is a photo part or all of the RAM and placing it on a non-volatile medium ( HDD). In other words, the contents of RAM are fully or partially copied to the media, and the user can analyze the memory dump.
There are several types of memory dumps:
Small dump(Small Memory Dump) – saves a minimum amount of RAM, which contains information on critical errors (BSoD) and components that were loaded during system operation, for example, drivers, programs. MiniDump is stored in the path C:\Windows\Minidump.
Full dump(Complete Memory Dump) – the full amount of RAM is saved. This means that the file size will be equal to the amount of RAM. If there is little disk space, it will be problematic to save, for example, 32 GB. There are also problems with creating a memory dump file larger than 4 GB. This type used very rarely. Stored at C:\Windows\MEMORY.DMP.
Dump kernel memory– only information related to the system core is saved.
When the user gets to analyzing the error, he only needs to use minidamp (small dump). But before this, it must be turned on, otherwise the problem will not be recognized. Also, to more effectively identify a crash, using a full memory snapshot is preferable.
Information in the registry
If you look into Windows registry, then you can find some useful image parameters. Click the Win+R key combination and enter the command regedit and open the following branches:
HKEY_LOCAL_MACHINE\SYSTEM\CurrentControlSet\Control\CrashControl
In this branch the user will find the following parameters:
- AutoReboot– enable or disable reboot after creating a Blue Screen of Death (BSoD).
- DumpFile– name of dump types and location.
- CrashDumpEnabled– the number of the file being created, for example, the number 0 – the dump is not created; 1 – creating a full dump; 2 – creating a core dump; 3 – creating a small dump.
- DumpFilters– the option allows you to add new functions before creating a snapshot. For example, file encryption.
- MinidumpDir– the name of the small dump and its location.
- LogEvent– activation of recording information in the system log.
- MinidumpsCount– set the number of small dumps to be created. (Exceeding this number will destroy old files and replace them).
- Overwrite– function for a full or system dump. When creating a new photo, the previous one will always be replaced with a new one.
- DedicatedDumpFile– creating an alternative image file and specifying its path.
- IgnorePagefileSize– used for temporary snapshot location, without using a swap file.
How it works
If a failure occurs, the system completely stops its operation and, if dumping is active, it will be written to a file placed on disk. information about the problem that has arisen. If something happened to the physical components, then an emergency code will work, and the hardware that failed will make some changes, which will certainly be reflected in the snapshot.
Typically the file is stored in a block allocated for the swap file hard drive, after the BSoD appears, the file is overwritten in the type that the user himself configured (Small, full or core dump). Although, in modern operating systems, the participation of the paging file is not necessary.
How to enable dumps
IN Windows 7:
IN Windows 8 and 10:
Here the process is a little similar, you can get into the system information in the same way as in Windows 7. In “Ten”, be sure to open “ This computer", click on the free space with the right mouse button and select " Properties" Another way to get there is through the Control Panel.
Second option for Windows 10:

It should be noted that in the new Windows versions 10 new points appeared that were not in the “seven”:
- Small dump memory 256 KB - minimum failure data.
- Active dump- appeared in the tenth version of the system and saves only the active memory of the computer, the system kernel and the user. Recommended for use on servers.
How to delete a dump
Just go to the directory where the memory snapshots are stored and simply delete them. But there is another way to remove it - using the Disk Cleanup utility:

If no items were found, the dumps may not have been enabled.
Even if you once enabled them, some system optimization utilities you use can easily disable some functionality. Often a lot of things turn off during use SSD drives, since repeated reading and writing procedures greatly harm the health of this disk.
Memory dump analysis using WinDbg
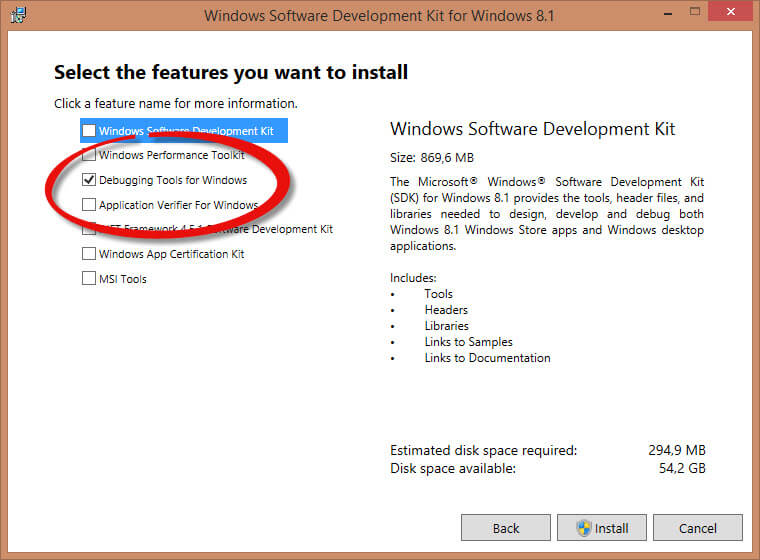
Download from the official Microsoft website this program in step 2, where it is described “ InstallationWDK" - https://docs.microsoft.com/en-us/windows-hardware/drivers/download-the-wdk. 
To work with the program you will also need a special package of debugging symbols. It is called Debugging Symbols, previously it could be downloaded from the Microsoft website, but now they have abandoned this idea and you will have to use the File program function - “ Symbol File Path", where you should enter the following line and click OK:
set _NT_SYMBOL_PATH=srv*DownstreamStore*https://msdl.microsoft.com/download/symbols
If it doesn't work, try this command:
SRV*%systemroot%\symbols*http://msdl.microsoft.com/download/symbols
Click “File” again and select the “Save Workspace” option.
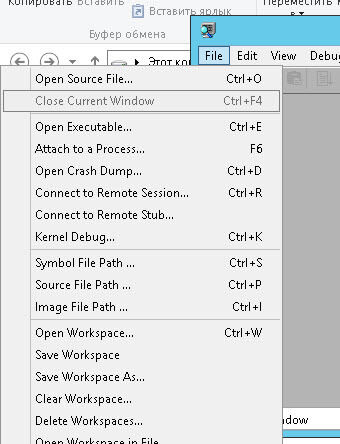
The utility is configured. All that remains is to specify the path to the memory dump files. To do this, click File and click the option “ OpenCrashDump" The location of all dumps is indicated at the beginning of the article.
After selection, the analysis will end and the problematic component will be automatically highlighted. To obtain more information in the same window, you can enter the following command: !analyze –v 
Analysis with BlueScreenView
You can download the tool for free from this site - http://www.nirsoft.net/utils/blue_screen_view.html. Installation does not require any skills. Only used on Windows 7 and higher.
We launch and configure. Click “Options” – “ Extra options"(Advanced Options). Select the first item " Load MiniDumps from this folder"and indicate the directory - C:\WINDOWS\Minidump. Although you can simply click the “Default” button. Click OK.
The dump files should appear in the main window. It can be either one or several. To open it, just click on it with the mouse. 
The bottom of the window will display the components that were running at the time of the failure. The person responsible for the accident will be highlighted in red.
Now click “File” and select, for example, the item “ Find in Google error code + driver" If found required driver, install and restart your computer. Perhaps the error will disappear.
Or, as it is also called, BSOD, can significantly ruin the life of both the computer and the server, and it also turned out virtual machine. Today I’ll tell you how to analyze blue screen dump memory in Windows, since correct diagnosis and obtaining the reason why your system does not work, 99 percent of its solution, especially a system engineer, is simply obliged to be able to do this, and even in the shortest possible time, since this can result in business As a result of service downtime, you lose a lot of money.
BSOD decryption
Let's first look at what this abbreviation means, BSOD from the English Blue Screen of Death or also STOP error mode.
Blue screen of death errors occur for various reasons, including driver problems, a faulty application, or a faulty RAM module. As soon as you have a blue screen in Windows, your system will automatically create a crash memory dump file, which we will analyze.
How to configure memory dump creation
By default windows when there is a blue screen, it creates a crash dump file memory.dmp, now I will show how it is configured and where it is stored, I will show with an example Windows Server 2008 R2, as I recently had a task to investigate the issue of a blue screen in a virtual machine. In order to find out where dump memory windows is configured, open Start and right-click on the Computer icon and select properties.
How to analyze blue screen dump memory in Windows - Computer Properties

How to analyze blue screen dump memory in Windows system settings
Go to the Advanced tab - Boot and Recovery. Click the Settings button

How to analyze blue screen dump memory in Windows - Boot and recovery
Where is the memory.dmp file stored?
and we see that first of all there is a checkbox to perform an automatic reboot to record debugging information, Kernel memory dump is selected and below there is where the memory dump is saved %SystemRoot%\MEMORY.DMP

Let's go to the c:\windows\ folder and find the file MEMORY.DMP it contains blue screen of death codes

How to analyze blue screen dump memory in Windows-memory.dmp
How to set up mini dump
Blue screen of death errors are also recorded in the small memory dump; it is configured there, you just need to select it.

It is stored in the c:\windows\minidump folder. The advantage is that it takes up less space and is created as a separate file for each blue screen. You can always view the history of blue screen occurrences.

Now that we have figured out where to look for the memory dump file, we need to learn how to interpret it and understand the reason why the blue screen of death occurs. Microsoft Kernel Debugger will help us solve this problem. You can download Microsoft Kernel Debugger from the official website, the main thing is to select the desired OS version. If someone breaks it, you can download it from the Yandex disk using a direct link. It is also part of ADK.
Download Microsoft Kernel Debugger, as a result you will have a small file that will allow you to download everything you need from the Internet. Let's launch it.

We will not participate in the quality improvement program

Click Accept and agree to the license

How to install Microsoft Kernel Debugger - agree to the license
will begin Microsoft installation Kernel Debugger

How to Install Microsoft Kernel Debugger - MKD Installation
We see that Microsoft Kernel Debugger has been successfully installed

After which we see that the Debugging Tools for Windows folder has appeared in the startup for both 32 and 64 bit systems.

In addition to the Debugging Tools for Windows package itself, you will also need a set of debugging symbols - Debugging Symbols. The set of debugging symbols is specific to each OS on which the BSoD was recorded. Therefore, you will have to download a set of symbols for each OS whose operation you will have to analyze. A 32-bit Windows XP will require the Windows XP 32-bit character set; a 64-bit OS will require the Windows XP 64-bit character set. For other OS Windows family character sets are selected according to the same principle. You can download debugging symbols from here. It is recommended to install them at %systemroot%\symbols although I like to install them in separate folders and not clutter Windows folder.
Blue Screen Analysis in Debugging Tools
After installing Debugging Symbols for the system that had the blue screen of death, launch Debugging Tools

How to install Microsoft Kernel Debugger - Run
Before analyzing the contents of the memory dump, you will need to do a little configuration of the debugger. Specifically, tell the program where to look for debugging symbols. To do this, select File > Symbol File Path… from the menu.
Click the Browse button...

and indicate the folder in which we installed the debugging symbols for the memory dump in question, you can specify several folders separated by commas and you can request information about the required debugging symbols directly via the Internet, from a public Microsoft server. This way you will have the most a new version characters. You can do this as follows - in the File > Symbol File Path… menu, enter:
SRV*%systemroot%\symbols*http://msdl.microsoft.com/download/symbols

How to analyze the blue screen of death
We copy the memory.dmp or minidump file from the computer where the blue screen popped up, and open it, select File > Open Crash Dump... from the menu and select the file required for consideration.

How to analyze the blue screen of death-01
For example, choose minidump

How to analyze the blue screen of death - open minidump
The analysis of the minidump will begin, we see a link to the error appear, click on it for more detailed information about the blue screen.

How to analyze the blue screen of death-03
And we see a faulty application that is destroying your system, you can also see what’s wrong in even more detail by clicking on the link.

How to analyze the blue screen of death-04
Get more detailed information due to blue screen.

How to analyze the blue screen of death-05
If you open memory.dmp, you will get a similar picture and see why you got a blue screen.

How to analyze the blue screen of death-06

This is how easy it is to diagnose and eliminate the blue screen of death.