1 slide

2 slide

3 slide
Geographic Information system(GIS) is a modern information technology for visualization and analysis of real world objects, as well as events taking place on our planet. This technology combines traditional database operations such as query and statistical analysis with the full 2D and 3D visualization and geographic (spatial) analysis benefits that a map provides.

4 slide
GIS is now a multi-million dollar industry involving hundreds of thousands of people around the world. GIS is taught in schools, colleges and universities. This technology is used in almost all spheres of human activity - whether it is the analysis of such global problems as overpopulation, pollution of the territory, the reduction of forest land, natural disasters, and the solution of particular problems, such as finding the best route between points, selecting the optimal location of a new office, searching houses at his address, laying a pipeline on the ground, various municipal tasks.

5 slide
Components of a GIS A working GIS includes five key components: hardware, software, data, actors, and methods.

6 slide
Hardware. This is the computer running the GIS. GIS today run on various types of computer platforms, from centralized servers to stand-alone or networked desktop computers.

7 slide
GIS software contains the functions and tools needed to store, analyze and visualize geographic (spatial) information. The key components of the software products are: tools for entering and operating geographic information; database management system (DBMS or DBMS); tools for supporting spatial queries, analysis and visualization (display); graphical user interface (GUI or GUI) for easy access to tools.

8 slide
Data. This is probably the most important component of a GIS. Location data (geographical data) and associated tabular data may be collected and prepared by the user, or purchased from vendors on a commercial or other basis. In the process of managing spatial data, a GIS integrates spatial data with other types and sources of data, and can also use DBMS, which are used by many organizations to organize and maintain the data at their disposal.

9 slide
Performers. The widespread use of GIS technology is impossible without people who work with software products and develop plans for their use in solving real tasks. GIS users can be both technical specialists who develop and maintain the system, as well as ordinary employees (end users) who are helped by GIS to solve current everyday affairs and problems.

10 slide
Methods. The success and efficiency (including economic) of the use of GIS largely depends on a properly drawn up plan and rules of work, which are drawn up in accordance with the specific tasks and work of each organization.

11 slide
Tasks that a GIS solves A general-purpose GIS, among other things, usually performs five procedures (tasks) with data - input, manipulation, control, query and analysis, and visualization.

12 slide
Input. To be used in a GIS, the data must be converted to a suitable digital format. The process of converting data from paper maps into computer files is called digitization. In modern GIS, this process can be automated using scanner technology, which is especially important when performing major projects, or, with a small amount of work, data can be entered using a digitizer. Many data have already been translated into formats that are directly perceived by GIS packages.

13 slide
Manipulation. Often, for a specific project, the existing data needs to be further modified to meet the requirements of your system. For example, geographic information can be at different scales (street centerlines are available at 1:100,000, census county boundaries are at 1:50,000, and residential properties are at 1:10,000). For joint processing and visualization, it is more convenient to present all data on a single scale. GIS technology provides different ways manipulating spatial data and extracting the data needed for a specific task.

14 slide
Control. In smaller projects, geographic information may be stored as regular files. But with an increase in the amount of information and an increase in the number of users for storing, structuring and managing data, it is more efficient to use database management systems (DBMS), then special computer tools for working with integrated data sets (databases). In GIS, it is most convenient to use a relational structure in which data is stored in tabular form. In this case, common fields are used to link tables. This simple approach is quite flexible and is widely used in many GIS and non-GIS applications.

15 slide
Request and analysis. With GIS and geographic information, you can get answers to simple questions (Who owns this land?) and more complex queries that require additional analysis (Where are there places to build a new house?). With the help of GIS, you can identify and set search patterns, play scenarios like “what will happen if…”. Modern GIS has many powerful tools for analysis, two of the most significant are proximity analysis and overlay analysis. To analyze the proximity of features relative to each other, a GIS uses a process called buffering. It helps answer questions like: How many houses are within 100 m of this body of water? The overlay process involves the integration of data located in different thematic layers. In the simplest case, this is a mapping operation, but in a number of analytical operations, data from different layers is physically combined. Overlay, or spatial aggregation, allows, for example, the integration of soil, slope, vegetation, and land ownership data with land tax rates.

16 slide
Visualization. For many types of spatial operations, the end result is a representation of the data in the form of a map or graph. A map is a very efficient and informative way of storing, presenting and communicating geographic (spatially referenced) information. Previously, maps were created for centuries. GIS provides amazing new tools that expand and advance the art and science of cartography. With its help, the visualization of the maps themselves can be easily supplemented with reporting documents, three-dimensional images, graphs and tables, photographs and other means, such as multimedia.

17 slide
What can GIS do for you? Make spatial queries and analyze. Improve integration within the organization Make more informed decisions Create maps

18 slide
Make spatial queries and analyze. The ability of GIS to search databases and perform spatial queries has saved many companies millions of dollars. GIS helps to reduce the time to receive responses to customer requests; identify areas suitable for the required activities; identify relationships between different parameters (eg soils, climate and crop yields); locate power outages. Realtors use GIS to find, for example, all homes in a given area that have slate roofs, three rooms, and 10-meter kitchens, and then come up with more detailed description these buildings. The query can be refined by introducing additional options, for example cost. You can get a list of all houses located at a certain distance from a certain highway, forest park, or place of work.

19 slide
Improve integration within the organization Many organizations using GIS have found that one of its main advantages lies in the new opportunities to improve the management of their own organization and its resources based on the geographical consolidation of existing data and the possibility of sharing and consistent modification by different departments. The possibility of sharing and constantly growing and correcting the database by different structural divisions makes it possible to increase the efficiency of work, both for each division and for the organization as a whole.

20 slide
Making more informed GIS decisions like others information Technology, confirms the well-known saying that better information helps to make The best decision. GIS helps, for example, in solving such problems as providing a variety of information at the request of planning authorities, resolving territorial conflicts, etc. The information required for decision-making can be presented in a concise cartographic form with additional text explanations, graphs and diagrams. You can quickly consider several solutions and choose the most effective and efficient.

21 slide
Creating Maps Maps have a special place in GIS. The process of creating maps in GIS is simple and flexible. It starts with creating a database. Digitization of ordinary paper maps can also be used as a source for obtaining initial data. GIS-based cartographic databases can be continuous (without division into separate sheets and regions) and not associated with a specific scale. Based on such databases, maps can be created (in in electronic format or as hard copies) to any territory, any scale, with the necessary load, with its selection and display with the required symbols.
slide 2
- 1. What is a GIS?
- GIS is a set computer equipment, geographical data and software for collecting, processing, storing, modeling, analyzing and displaying all types of spatially referenced information.
- GIS is a medium that links geographic information (where what is) with descriptive information (what it is). Unlike conventional paper maps (even scanned ones) that show what you see is what you get, GIS provides you with many layers of diverse general geographic and thematic information.
slide 3
How information is stored in a GIS
All initial information - where the points are located, what is the length of the roads or the area of the lake - is stored in separate layers in digital form on a computer. And all this geographic data is sorted into layers, with each layer representing a different feature type (theme). One of these topics can contain all roads in a certain area, another - lakes, and the third - all cities and other settlements in the same area.
slide 4
GIS can be viewed in three ways
- GIS can be viewed in three ways:
- Database type: A GIS is a unique type of database about our world - a geographic database. This is the Information System for Geography. A GIS is based on a structured database that describes the world in geographical terms, in terms of the spatial arrangement of its objects and phenomena.
- Map View: A GIS is a collection of smart maps and other graphical views that show objects and their relationships on the earth's surface. Maps can be generated and used as a "window to the database" to support queries, analysis and editing of information. These actions are called geovisualization.
- Model type: GIS is a set of tools for transforming information. They allow you to create new geographic datasets from existing ones by applying special analytical functions to them - geoprocessing tools. In other words, by combining data and applying some rules, you can create a model that helps you find answers to your questions.
slide 5
What can be done with GIS
- Make spatial queries and analyze
- search databases and perform spatial queries
- identify areas suitable for the required activities; identify relationships between different parameters (eg soils, climate and crop yields); locate power outages
slide 6
Where are GIS applied?
- Realtors use GIS to find, for example, all houses in a certain area
- Engineering communications company
- GIS are used for graphical mapping and obtaining information as about separate objects
- GIS helps, for example, in solving such problems as providing a variety of information at the request of planning authorities, resolving territorial conflicts, choosing optimal (from different points of view and according to different criteria) places for placing objects, etc.
Slide 7
What is GPS
GPS- satellite system navigation that measures distance, time and location.
Slide 8
GPS has a number of uses on land, at sea and in the air. Basically, they can be used anywhere where you can get a signal from the satellite, except inside buildings, in mines and caves, underground and underwater.
Slide 9
GPS receiver - a radio receiver for determining the geographic coordinates of the current location of the receiver antenna, based on data on the time delays in the arrival of radio signals emitted by satellites of the NAVSTAR group. In Russia, with the development of the GLONASS system, serial production of GLONASS receivers began by a number of design bureaus and organizations.
Slide 10
- The presence of the card significantly improves the user characteristics of the receiver. Receivers with maps show the position of not only the receiver itself, but also objects around it.
- All electronic GPS-maps can be divided into two main types - vector and raster.
slide 11
What is geocaching
Geocaching (geocaching otgrech.γεο- - Earth and English cache - cache) - a tourist game using satellite navigation systems, consisting in finding caches hidden by other participants in the game.
slide 12
- It can be played with family, company or alone
- Geocaching is actively used as a corporate entertainment. Employees of the providing company hide caches, instruct participants, provide them with equipment and GPS-navigators.
slide 13
- Google's project, within the framework of which satellite photographs of the entire earth's surface were placed on the Internet. Photos of some regions have an unprecedented high resolution.
- In many cases Russian google version Earth is called Google Earth, for example, in the main menu or on the official website.
Slide 17
Task 1: Using the Catalog tool (in the upper left corner of the program), look at the catalog of organizations in the city of Saratov. Task 2: Use the "Search" system. Enter the address (optional), district. The program will automatically indicate the required address. Task 3: To build a route by public transport or car between any points on the map, use the block "How to get there?" on the Search tab.
Slide 18
View all slides

- Geoinformatics- science, technology and production activities for scientific substantiation, design, creation, operation and use of geographic information systems, for the development of geoinformation technologies, for the application of GIS for practical and scientific purposes.

Geographic information system (GIS) -
it is an information system that provides collection, storage, processing, access, display and analysis of spatial (spatially coordinated) data.


Data (spatial data):
- positional (geographic): the location of the object on the earth's surface, its coordinates in the selected coordinate system;
- non-positional (attributive, or metadata) - descriptive text, electronic documents, graphic type data, including photographs of objects, 3D images of objects, videos, etc.


- data input into the machine environment (data input) by importing them from existing digital data sets or by digitizing sources;
- transformation or transformation of data (data transformation), including converting data from one format to another, transformation of map projections, change of coordinate systems;
- storage, manipulation and management of data in internal and external databases;
- cartometric operations (see cartometry), including the calculation of distances between objects in the map projection or on an ellipsoid, the lengths of curved lines, perimeters and areas of polygonal objects;

- geodetic measurement data processing operations (COGO);
- overlay operations (overlay);
- "map algebra" operations for logical-arithmetic processing of a raster layer as a whole;
- spatial analysis (spatial analysis) - a group of functions that provide analysis of the placement of links and other spatial relations of objects, including analysis of visibility / invisibility zones, neighborhood analysis (see proximity analysis), network analysis, creation and processing of digital elevation models, analysis of objects within buffer zones, etc.;

- spatial modeling or geo-modeling (spatial modeling, geo-modeling), including operations similar to those used in mathematical-cartographic modeling and cartographic research method;
- visualization of initial, derived or final data and processing results, including cartographic visualization, design and creation (generation) of cartographic and other spatial images, including three-dimensional ones;
- data output (data output) - graphic, tabular and text documentation, including its replication, documentation, or report generation (reporting);
- servicing the decision making process


- digital image processing (remote sensing data);
- means of expert systems;
- customization tools for user requirements (customization);
- expansion tools functionality GIS:
- built-in macro languages (macros); developer toolkit (developer's toolkit).
- built-in macro languages (macros);
- developer toolkit (developer's toolkit).


- Each spatial object corresponds to a record in the database with a set of attribute information
- A GIS stores information in the form of a set of thematic layers that are grouped together based on geographic location.

Layer examples
- Settlements
- Car roads
- Railways
- Hydraulic structures (locks, canals, pumping stations, dams)
- Bridges
- Gas pipelines
- Protected areas (of local, national and international importance)
- Agricultural land (arable land, orchards, vineyards, pastures, rice paddies)
- Water, forest, nature protection and agricultural land
- Vegetation cover (floods, forests)
- Administrative division, state border
- Watercourses (rivers, channels, small rivers)
- Reservoirs (lakes, fishponds, etc.)
- Relief

Vector and raster data models
- In a vector model, information about points, lines, and polygons is encoded and stored as a set X,Y coordinates(modern GIS often adds a third spatial and a fourth, for example, time coordinate). The vector model is especially suitable for describing discrete objects and is less suitable for describing continuously changing properties (for example, population density).


Problem classes
- Information and reference tasks
- Network tasks
(Analysis of geographic networks: streets, rivers, roads, pipelines, power or communication lines, etc.)
- Spatial analysis and modeling

Examples of queries that a GIS can answer
- Getting information by location
- Location information
- Temporal analysis of changes in objects on the territory
- Show spatial relationships and relationships between objects in a given area
- What if…? (what if analysis)

Spheres of application of GIS
- Cadastre
- Operational services (Ministry of Internal Affairs, Ministry of Emergency Situations ..)
- Oil and gas
- Transport
- Ecology
- Forestry
- Water resources
- Subsoil use
- Agriculture
- Geodesy, cartography, geography
- Telecommunications
- Engineering Communication
- Business
- Trade and services

- http :// www . geoportal . fr /
- http :// gki . com . ua

MAPPING
Acquisition of spatial data
Lecture #1:
"Essence and basic concepts of geoinformatics"
1. Lissitzky D.V. Basic principles of digital terrain mapping. M. Nedra, 1988.
2. Kapralov E.G., Koshkarev A.V. and others. Fundamentals of geoinformatics: in 2 books. Textbook for students. universities; Ed. Tikunova V.S.-M.; Publishing Center "Academy", 2004.-352 and 480 pages.
3. Karpik A.P. Methodological and technological bases of geoinformation support of territories: Monograph. - Novosibirsk: SSGA, 2004.-260s.
4. Topographic information classifier. M.: GUGK USSR,
5. GOST 28441-90. Digital cartography. Terms and Definitions. - M.; 1990.
6. GOST R 50828-95. Geoinformation mapping. Spatial data, digital and electronic cards. General requirements. M.; 1995.
7. Berlyant A.M. Geoinformation mapping. M: 1997
8. Zhalkovsky E.A., Khalugin E.I. etc. Digital cartography and geoinformatics. Brief terminological dictionary / Under the general editorship of E.A., Zhalkovsky. - M., "Kartgeocenter-Geodesizdat", 1999.- 46 p.
The entire history of human development is divided into 3 eras:
1. The agricultural era lasted 6,000 years
2. The industrial (industrial) era lasted 150 years
3. At the turn of the 20th and 21st centuries, mankind entered into
information age
This means that the main factor in the development of human civilization is informational resources, A
information is an integral part of all human activities.
The most important component of information is geoinformation - spatially coordinated information about the geographic space surrounding us.
In the tasks of territorial administration, about 70% of decisions are related to the use of geoinformation.
The issues of obtaining and using geoinformation are based on
new concept - geoinformatics.
Geoinformatics definition
Geoinformatics originated as a means of environmental analysis and research in geography and is defined in three aspects:
1. Like a science
2. How information technology
3.How to production (information industry)
Geoinformatics as a science:
"The scientific discipline that studies natural
And socio-economic geosystems through
computer simulation
based on databases and geographical knowledge"
Geoinformatics as
information technology:
"Technology for the collection, processing, accumulation, storage, transformation, analysis and display of spatially coordinated information"
Geoinformatics as
production:
"Production activities for obtaining and processing spatially coordinated information and preparing spatial solutions, as well as for the creation and operation of geographic information systems and technologies"
Connection of geoinformatics with related fields of science and production
Geodesy Cartography
Geography Geoinformatics Geoecology
Remote Informatics Sensing
The most important features of geoinformatics:
1. Unique identification of objectsspace using gridding
2. Modeling of all objects
space as points, lines and areas, abstracting from their essence
3. Mathematical processing
abstract objects - points, lines and areas
Composite sections of geoinformatics
Geoinformation mapping
- creation of a spatial information resource
GIS processing - p processing of a spatial resource into spatial solutions


 Back forward
Attention! The slide preview is for informational purposes only and may not represent the full extent of the presentation. If you are interested in this work, please download the full version.
Item: informatics and ICT.
Program section: Construction and research of information models.
Lesson type: learning new material, lesson-research.
Type of lesson: combined.
Equipment: computer class, projector, digital board, lesson summary, description of practical work, aerial and space images of the city of Smolensk, school district, school, satellite image of the Smolensk region.
Software: operating room Windows system Opera, Microsoft program Power Point, Delphi, program "Streets of the city of Smolensk", presentation for the lesson Geographic Information Systems.pps prepared by the teacher.
Lesson Objectives:
- Educational - introduce students to geoinformation systems, with techniques search and navigation tools of geographic information systems, with the importance of space images in the creation of GIS, to form the ability of students to work with space images.
- Developing - to develop the cognitive interest of students, the ability to apply the acquired knowledge in practice, to instill research skills.
- Educational - to raise the level of information culture and social adaptation of students, to cultivate interest and love for the small Motherland - the Smolensk region.
Lesson plan:
Part I(1 hour)
- Organizing time.
- Preparatory independent work .
- Update of basic knowledge.
- Explanation of new material and primary consolidation of knowledge .
- Performing practical work.
Part II(2 hours)
- Practical work:
– creation of GIS;
- filling in GIS. - Homework assignment.
STROKE I LESSON
1. Organizational moment
Teacher. The topic of the lesson is "Geoinformation systems". In the first lesson, you will get acquainted with geographic information systems, search techniques and navigation tools in geographic information systems, in the next lesson you will create a simple GIS yourself.
slide 1.
2. Preparatory independent work
- First, each of you works independently for 5 minutes.
1 student is preparing to answer the question "Information Models". The rest of the students are divided into groups and, using search engines, prepare to answer the questions:
Group 1 - "What are geographic information systems";
Group 2 - "Types of geographic information systems";
Group 3 - "GIS Structure";
Group 4 - "GIS application".
3. Actualization of basic knowledge
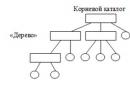
Slide 2. After completing the diagram, talk about information models.
The student answers the question on the slide.
Teacher. Give examples of information models for the Smolensk region.
students(possible answers). slide 3 .
- Graphic:
- physical map, map of the administrative division of the Smolensk region, etc.;
- graphs of average monthly temperatures, employment of the population, etc.;
- pipeline diagram, electrical networks and etc.;
- tree of administrative division of the region.
- Tabular:
- alumni databases;
- exam results, etc.
- Mathematical:
- payroll calculation;
- calculation of utility bills, etc.
- Verbal
After the students' answers, the teacher reads out: Smolensk region ( Smolensk region)
- subject Russian Federation, is part of the Central Federal District.
- It borders on the Moscow, Kaluga, Bryansk, Pskov and Tver regions of Russia, as well as on the Mogilev and Vitebsk regions of Belarus.
- Square- 49,778 km?.
- Population- 0.966 million people (for 2010).
- Regional center– the city of Smolensk, the distance to Moscow is 365 km by road.
- Educated- September 27, 1937 in the Western region. She was awarded the Order of Lenin (1958), in 1985 she was awarded the title of Hero City.
4. Explanation of new material
Teacher. We have already said that geographic maps are one of the types of graphic information models. The present time is unimaginable without a computer that has given a new life to maps - maps have become digital. Geoinformation modeling is based on the creation of multilayer electronic maps, in which the reference layer describes the geography of a certain territory, and each of the others is one of the aspects of the state of this territory. Various layers of objects can be displayed on a geographic map: cities, roads, airports, etc. Geoinformation modeling is associated with
Geographic Information Systems or GIS.
Let's give the floor to the students of the group that worked on the question "What is GIS".
slide 4. What is a GIS?
Teacher. It is rather difficult to give an unambiguous short definition of this phenomenon. The guys gave more than one definition.
Geographic Information System (GIS) is an opportunity for a new look at the world around us.
Geographic information system is a system designed to collect, store, analyze spatial data and related information.
The term is also used in a narrower sense - GIS as a tool (software product) that allows users to search, analyze and edit digital maps, as well as Additional information about objects, for example, the height of the building, the address, the number of residents.
GIS (Geographic Information System) – it is a modern computer technology for mapping and analyzing objects of the real world, as well as events taking place on our planet, in our life and work.
This technology combines traditional database operations such as query and statistical analysis with the rich visualization and geographic (spatial) analysis benefits that a map provides. On GIS maps, you can apply not only geographical, but also statistical, demographic, technical and many other types of data and apply various analytical operations to them.
These capabilities distinguish GIS from other information systems and provide unique opportunities for its application in a wide range of tasks related to the analysis and forecasting of phenomena and events of the surrounding world, with understanding and highlighting the main factors and causes, as well as their possible consequences, with the planning of strategic decisions. and current consequences of the actions taken. ,
Let's give the floor to the students of the group that worked on the question "Types of geoinformation systems".
The students respond and the teacher completes.
Slide 5. Types of geoinformation systems.
Shared geodata are used when creating and working various types geoinformation systems:
- professional (for government and industry structures);
- open GIS, which are available at workstations of various specialists within the region and country;
- embedded GIS - systems installed on cars, water transport, submarines, modern railway transport;
- GPS (Geo Position System) is a navigation system using satellite information.
- Internet GIS - in various network portals that provide electronic maps;
- CAD-GIS - in automatic design systems in the construction of buildings and communications, landscape design;
- desktop GIS - those systems that are installed on work and home computers.
Teacher. What parts does a GIS consist of, the next group will answer us.
The students respond and the teacher completes.
slide 6. GIS structure
Hardware. A computer for working with GIS can be from the simplest PC to the most powerful supercomputers. The computer is the backbone of the GIS equipment and receives data through a scanner or from databases. The monitor will allow you to observe and analyze GIS data. Printers and plotters are the most common means of displaying the final results of GIS work done on a computer.
Program. GIS software performs the storage, analysis and presentation of geographic information. The most widely used GIS programs are MapInfo, ARC/Info, AutoCADMap and others.
Data. The choice of data depends on the task and the possibilities of obtaining information. Data can be used from various sources - databases of organizations, the Internet, commercial databases, etc.
Users. The people who use GIS can be conventionally divided into the following groups: GIS operators, whose job is to place data on the map, GIS engineers/users, whose function is to analyze and further work with this data, and those who, based on the results obtained, need to make decisions solution. In addition, GIS can be used by the general public through off-the-shelf software applications or the Internet.
Method. There are many ways to create maps in GIS and how to work with them. The most productive GIS will be the one that operates according to a well-thought-out plan and operational approaches appropriate to the user's tasks.
Teacher. The question arises, how does a GIS work?
Slide 7
Unlike a conventional paper map, an electronic map created in a GIS contains hidden information that can be "activated" as needed. A GIS stores information about the real world as a set of thematic layers that are grouped together based on geographic location. Each layer consists of data on a specific topic. For example, information about the spatial position, binding to geographic coordinates, or links to an address and tabular data. A GIS uses cartographic material that is referenced in a given coordinate system. When such links are used to automatically determine the location of an object, a procedure called geocoding. With its help, you can quickly determine and see on the map where the object of interest and its characteristics are located. GIS allows you to quickly perform spatial analysis of data and, based on it, make effective management decisions.
For example, if you are exploring a certain area, then one layer of the map may contain data about roads, the second - about water bodies, the third - about hospitals, and so on. You can view each layer-map individually, or you can combine several layers at once, or select individual information from different layers and create thematic maps based on the selection.
Graphical information in GIS is stored in vector format. In a vector model, information about points, lines and polylines (houses, roads, rivers, buildings, etc.) is encoded and stored as a set of X,Y (Z, T) coordinates, which allows you to manipulate the image. The original image is entered from the scanner into bitmap format and then subjected to vectorization - setting formula relationships between lines and points.
Teacher. In what areas do you think GIS is used?
The students (next group) name the applications of GIS.
slide 8. Application of GIS.
Teacher. GIS is now a multi-million dollar industry involving hundreds of thousands of people around the world. GIS is taught in schools, colleges and universities. This technology is used in almost all spheres of human activity - whether it is the analysis of such global problems as overpopulation, pollution of the territory, the reduction of forest land, natural disasters, and the solution of particular problems, such as finding the best route between points, selecting the optimal location of a new office, searching houses at his address, laying a pipeline on the ground, various municipal tasks, etc.,.
slide 9. Working with GIS.
Students work on computers. A presentation is open on a computer network on all computers.
The program "Streets of the city of Smolensk"
Teacher. What does this GIS do?
The students respond and the teacher completes.
The program contains information about the streets of the city of Smolensk: street map, history and description of the street, photographs; information about the city of Smolensk. The search is carried out along the streets that have a name.
Practical work. Search city streets and information about them.
- Find Tvardovsky Street on the map.
- What is the toponym and history of the street?
- Find a photo of the street (http://www.smoladmin.ru/map)
Teacher. In the process of doing practical work, answer the question: “What does this GIS allow you to do?”
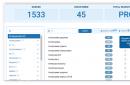
Practical work. Work with an open geographic information system of the city of Smolensk.
- After checking the appropriate boxes and updating the map, on the main map, find all the "Education" objects.
- Select the Address Plan card. Search by address to find the house you live in.
- Select the map "Cadastre of the city". Determine the cadastral value of the land in the location of your home.
The students answer the question posed by the teacher before doing practical work.
Teacher. Google Maps offers a map and satellite imagery of the entire world (including the Moon and Mars). The map integrates a business directory and a road map with a search for routes in the USA, Canada, Japan, Hong Kong, China, Great Britain, Ireland, European regions, as well as Russian cities.
Practical work. Neighborhoods of New York.
- Start with a general map of North America.
- Zoom in to show the US states on the map.
- Zoom in further on the map. In order not to get lost on the map, it is recommended to zoom in by double-clicking on the desired geographical feature.
- Consider a satellite photo of the same area.
Practical work. Sights of the Smolensk region.
- In the line "Search on the map" enter the name of the Chmelita estate.
- Zoom in on the map.
- Consider satellite imagery of the same area.
- See photos for this area.
This is a state historical, cultural and natural museum-reserve. On its territory there are unique memorial, architectural, historical and natural monuments of federal significance, associated with the names of A.S. Griboedova, A.S. Khomyakova, P.S. Nakhimova, S.S. Uvarova, M.A. Bulgakov.
slide 10. Space photography.
Teacher. As we could see during the practical work, the electronic map created in GIS is supported by means of the Internet and even by space images and information from satellites.
space photography– shooting of the earth's surface from spacecraft using special equipment (photography, scanner photography, thermal photography, etc.).
Previously, when studying the earth, cartographers spent entire centuries in order to map various geographical features. Now this can be done in just a few orbits of spacecraft. In just 10 minutes, the spacecraft can photograph up to 1 million square meters. km of the earth's surface, while such an area is removed from an aircraft in 4 years, and geologists and topographers would need approximately 80 years to do this. With the help of space photography, it was possible to erase many "white spots" in hard-to-reach areas of the earth.
Historical reference
I. The first pictures from space were taken
- from missiles in 1946,
- from artificial Earth satellites - in 1960,
- from manned spacecraft - in 1961 (Yu. A. Gagarin).
The first photograph from space was taken just over a year after the end of World War II. On October 24, 1946, a V-2 rocket launched from the White Sands launch pad in New Mexico rose to a height of 104.6 km. The camera installed on board took a picture every one and a half seconds of flight. After several minutes of being in outer space, the rocket returned to earth. The landing was not planned to be soft, and the rocket shattered, and with it the camera. The steel cassette with the film remained intact, and the scientists got their hands on a unique photographic material. Until 1946, the most "high-altitude" images of the Earth were considered to be photographs taken from the balloon Explorer II (22 km) in 1935.
II. In 1987, while in space at the Mir station, cosmonauts Yuri Romanenko, Alexander Laveikin and Alexander Alexandrov surveyed a large part of Antarctica. All this helped in creating a detailed map of this continent on a scale of 1:200,000 (2 km per cm). Such maps, and even on such a scale, simply cannot be made by other methods.
5. Doing practical work
Practical work. The area where I study.
- Open resource http://kosmosnimki.ru
- Enter Smolensk in the search bar.
- By changing the scale, find MBOU secondary school No. 29.
- Find the geographic coordinates of the school.
- Find the street boundaries of the school district and, using markers, sign them.
- Find a children's clinic, a library, a sports school near the school, kindergarten and sign them.
(In paragraphs 3-5, students take turns working with a digital board, marking the objects found.)
Teacher. In what areas are satellite images used?
students (possible answers): in environmental monitoring, forestry, agriculture, construction, cartography, cadastral activities, tourism activities, insurance .
slide 16. Use of space imagery and GIS technologies.
Teacher. How do you think satellite images are used in environmental monitoring, forestry, agriculture, construction, cartography, cadastral activities, tourism, insurance .
Slides 17-24.
STROKE II LESSON
Computer workshop "Creation of a geographic information system of the Smolensk region"
1. Creation of a program for working with a satellite image of the Smolensk region. Computer workshop on the proposed algorithm and code.
2. Entering the names of geographical objects on a satellite image of the Smolensk region.
Using the maps of the Smolensk region, the Internet resources http://kosmosnimki.ru and http://maps.google.com are applied to the satellite image of the city, river, lake of the Smolensk region.